How to Turn a CRM Export Into a Pipeline Report (Salesforce, HubSpot, or CSV)
To turn a CRM export into a pipeline report, pull the deal records to a CSV first. Normalize the stage names and currencies, remove duplicate rows, then calculate conversion, cycle time, and weighted value. The reporting is the easy half. The cleanup is where most of the time goes.
This guide walks through the export itself and the four data problems that break every pipeline report. It then covers the five numbers the report needs, and a faster route once the file is in hand.
What a CRM export actually contains
A deal or opportunity export is one row per record with the fields your team configured. That sounds simple until you open it.
| Column you expect | What you often get |
|---|---|
| Stage | A mix of current names and retired ones from past workflows |
| Amount | Several currencies, sometimes with symbols inside the cell |
| Close date | Blank on open deals, and repeatedly pushed on the rest |
| Owner | Names that changed spelling after a reassignment |
| Created date | Present, but not the date the deal entered each stage |
That last row matters more than it looks. Most exports give you a snapshot of where deals stand now, not a history of when they moved. Cycle time by stage needs the movement history, and a plain export usually does not carry it.
Ask for the field list before you export. A short conversation with whoever administers the CRM saves an hour of guessing at column meanings.
Getting the export out of your CRM
Salesforce
Salesforce documents more than one path, and which one you can use depends on your edition and permissions. The current reference is Salesforce's own exporting data page. Check it before assuming a path is available to your profile.
HubSpot
HubSpot exports the current property values and associations for the records you select. A few documented details shape what you get back.
CSV files have no column limit, so pick CSV when your export is field-heavy. Files over 2 MB arrive zipped. Very large exports split into multiple files. You receive an email with a download link, and that link expires after 30 days. HubSpot's export your records page has the full list.
Any other CRM
The pattern is the same everywhere. Export the deal or opportunity object, include the owner and the stage, and include both the created date and the close date. Export the raw records rather than a pre-summarized report, because a summary throws away the rows you need to recalculate anything.
One more habit pays off. Save the export settings you used, so next month's file has the same columns in the same order.
The four things that break every pipeline report
Stage names that do not line up
Teams rename stages. Old deals keep the old label. You end up with "Negotiation" and "Negotiating" and "Contract Sent" describing one step. Any stage-by-stage count is wrong until these are mapped to a single set.
Build the mapping table once, then reuse it. Every future export needs the same treatment.
Mixed currencies
If you sell in more than one currency, an amount column is not addable. Some exports include a converted amount field and some do not. Some store the symbol inside the cell, which turns the whole column into text.
Decide on a reporting currency, apply one rate per period, and note the rate in the report. Skipping this quietly overstates or understates the pipeline.
Duplicate and near-duplicate rows
Renewals cloned from the original, deals split across product lines, and test records left in production all inflate counts. Deduplicating on deal name alone is not safe, because legitimate repeat business shares names.
Match on a combination of account, amount, and close date, then review the flagged rows by hand. Count the rows you removed and say so in the report, because an unexplained drop reads as a data error.
Date fields that are not what they claim
Close date on an open deal is a forecast, not a fact. Created date is when the record appeared, which may be weeks after the first conversation. If you calculate cycle time from created date to close date, you are measuring record hygiene alongside sales velocity.
Say which dates you used, in the report, in one line.
The five numbers a pipeline report needs
| Number | How to calculate it | What it tells you |
|---|---|---|
| Deals and value by stage | Count and sum, grouped by mapped stage | Where the pipeline sits right now |
| Stage-to-stage conversion | Deals reaching stage N+1 divided by deals reaching stage N | Which step leaks |
| Win rate | Closed-won divided by all closed deals | Whether the leak is real or just slow |
| Average cycle time | Median days from entry to close, not the mean | How long a deal actually takes |
| Weighted pipeline | Value multiplied by the stage probability | A forecast that survives scrutiny |
Use the median for cycle time. One eighteen-month enterprise deal will drag a mean far from anything typical. Order matters when you present these numbers, so lead with the leak rather than the total.
Two guardrails are worth adding. Show the deal count next to every rate, so nobody reads a 50% conversion built on four deals as a trend. And compare against the prior period rather than a target, because a target tells you nothing about direction.
How to build the report with Powerdrill Bloom
Once the CRM export is on your machine, the remaining work is cleanup, math, and charts.
Step 1: Upload your CRM export
Drop in the Excel, CSV, or TSV file straight from the export email. Multiple files load together, so a deals export and an activities export can be joined in one pass without a manual lookup. Column detection and cleanup run on upload, which handles the type problems that make an amount column unaddable.

Step 2: Describe the report in natural language
Say what the report has to answer. For example: "map these stage names to one set, convert amounts to USD, then show value by stage, conversion, win rate, and median cycle time." The agent applies the mapping, does the math, and picks the charts. Ask for a breakdown by owner or region and it rebuilds instead of making you restructure the sheet.
Step 3: Export the chart, report, or deck
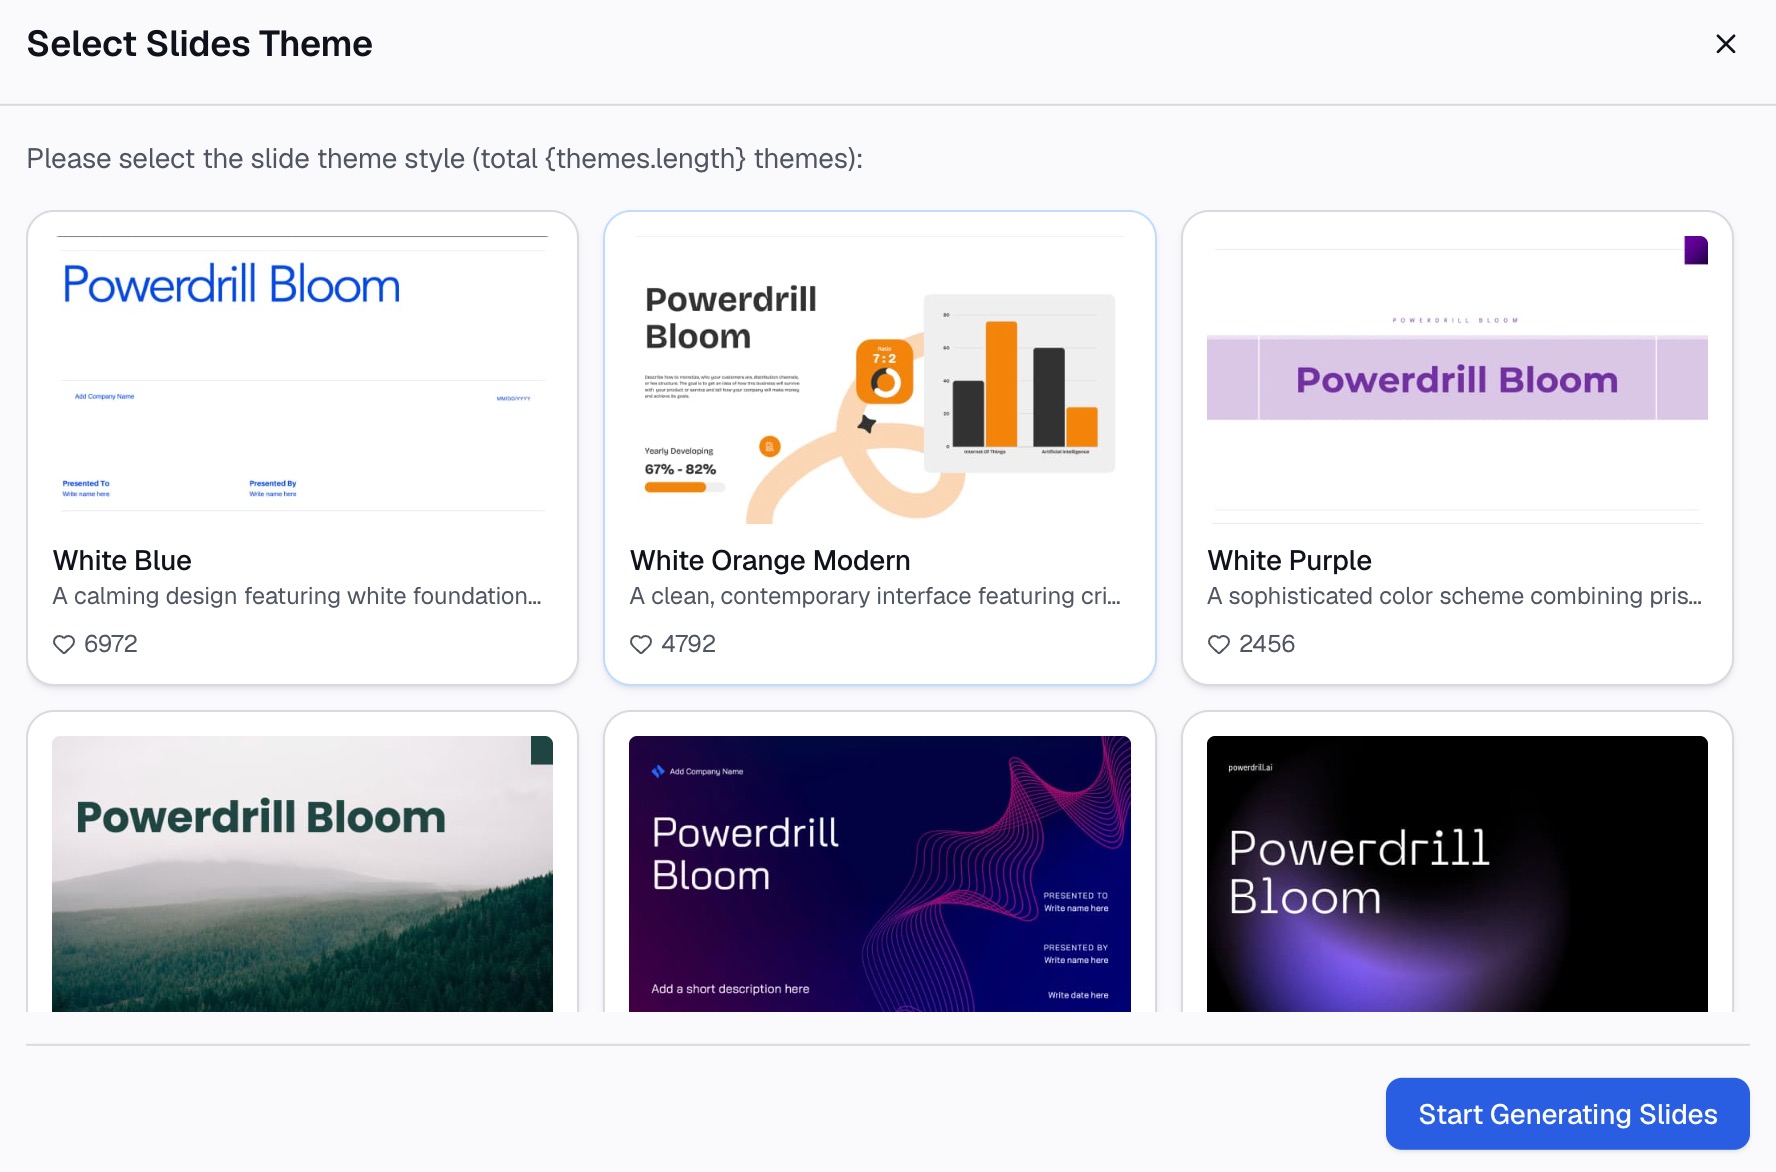
Take the finished view out as charts, as a written report, or as slides for the pipeline review. Professional, Business, and Fancy styles export to PowerPoint or Notion. The AI data cleaning page covers what happens to the messy columns on the way in.
Common mistakes
Reporting on a filtered export. If the export was filtered to open deals, your win rate has no denominator. Export closed deals too.
Counting deals instead of value. Twenty small deals and two large ones can produce the same stage count and completely different forecasts. Report both.
Treating stage probability as fixed. The default percentages in a CRM are configuration, not evidence. Recalculate them from your own historical win rates at least once a year.
Rebuilding the mapping every month. Save the stage mapping and the currency rates alongside the report. Next month's export will have the same problems.
Presenting the snapshot with no comparison. A pipeline number alone is unreadable. Put last period next to it.
Letting the report define the pipeline. A stage exists because the sales process has that step, not because the report needs a column.
The short version
A pipeline report is four cleanup steps and five calculations. The cleanup is the part that repeats: stage names drift, currencies mix, duplicates accumulate, and date fields mean less than their names suggest. Fix those once, write down what you did, and the report becomes reproducible.
If you rebuild the same report every month from a fresh CRM export, that repetition is the part worth automating. Try Powerdrill Bloom free — upload the file, describe the report in natural language, and export it to a deck. For tool comparisons, see AI tools for sales pipeline analysis, and for the live version, how to build an interactive sales dashboard from a CSV.
Frequently asked questions
How do I export deals from my CRM to CSV?
Export the deal or opportunity object rather than a saved summary report, and include stage, amount, owner, created date, and close date. In HubSpot, exports arrive by email as a download link that expires after 30 days. In Salesforce, the available paths depend on your edition and permissions.
What should a pipeline report include?
Five things: deals and value by stage, stage-to-stage conversion, win rate, median cycle time, and weighted pipeline value. Show deal counts next to every percentage, and compare against the previous period rather than against a target.
Why do my pipeline numbers not match the CRM dashboard?
Usually the filter, the currency, or the date field differs. Dashboards often exclude closed-lost deals or use a converted amount field that your CSV export does not include. Check all three before assuming the export is wrong.
How do I calculate sales cycle time from an export?
Use the median number of days between the date a deal entered the pipeline and the date it closed. A plain export typically lacks stage-entry dates, so per-stage cycle time needs a history object or a stage-change report from your CRM.
Should I use mean or median for cycle time?
Median. Sales cycles skew heavily, and a handful of long enterprise deals will pull a mean far above anything a rep would recognize. Report the median, and mention the longest deals separately if they matter.