How to Spot Crypto Trends With AI: Step-by-Step Workflow for 2026
Introduction
The cryptocurrency market in 2026 moves at a speed that traditional analytics struggle to match. With dozens of active blockchain networks, decentralized protocols, and thousands of newly minted tokens launching daily, staying ahead of trends requires processing vast amounts of unstructured information. Sifting manually through complex on-chain transactions, social media chatter, and developer repositories can lead to missed opportunities or analytical fatigue.
To bridge this gap, modern market participants are turning to artificial intelligence. AI-powered tools offer a structured approach to analyzing and interpreting vast datasets, turning raw, complex numbers into actionable market insights. This guide outlines how to utilize AI to identify emerging crypto trends and establishes a practical, step-by-step workflow to enhance your research methodology.
Why More Investors Are Using AI to Spot Crypto Trends in 2026
Lowering Technical Barriers with Natural Language: Traditionally, conducting deep analytical research on-chain required proficiency in SQL, Python, or specialized database querying languages. AI-powered tools lower this barrier by allowing investors to ask natural language questions directly to their datasets, making advanced research accessible to non-technical market participants.
Synthesizing On-Chain Metrics with Social Sentiment: Crypto markets are heavily driven by narrative shifts and community momentum. AI is particularly useful for cross-referencing on-chain capital flows with off-chain social media activity—such as tracking correlations between whale wallet movements and sudden spikes in community discussion—helping investors identify emerging narratives.
Automating Tedious Data Preparation: A significant portion of an analyst's time is spent cleaning raw spreadsheets, formatting tables, and removing anomalous data points. Specialized AI agents automate these repetitive preparation tasks, helping to minimize formatting errors and freeing up time for actual risk assessment and strategy formulation.
Top 5 Tools to Spot Crypto Trends
To build a reliable market-tracking toolkit, it is helpful to understand the strengths and limitations of the leading platforms available today. Here is a breakdown of five top tools for spotting crypto trends in 2026.
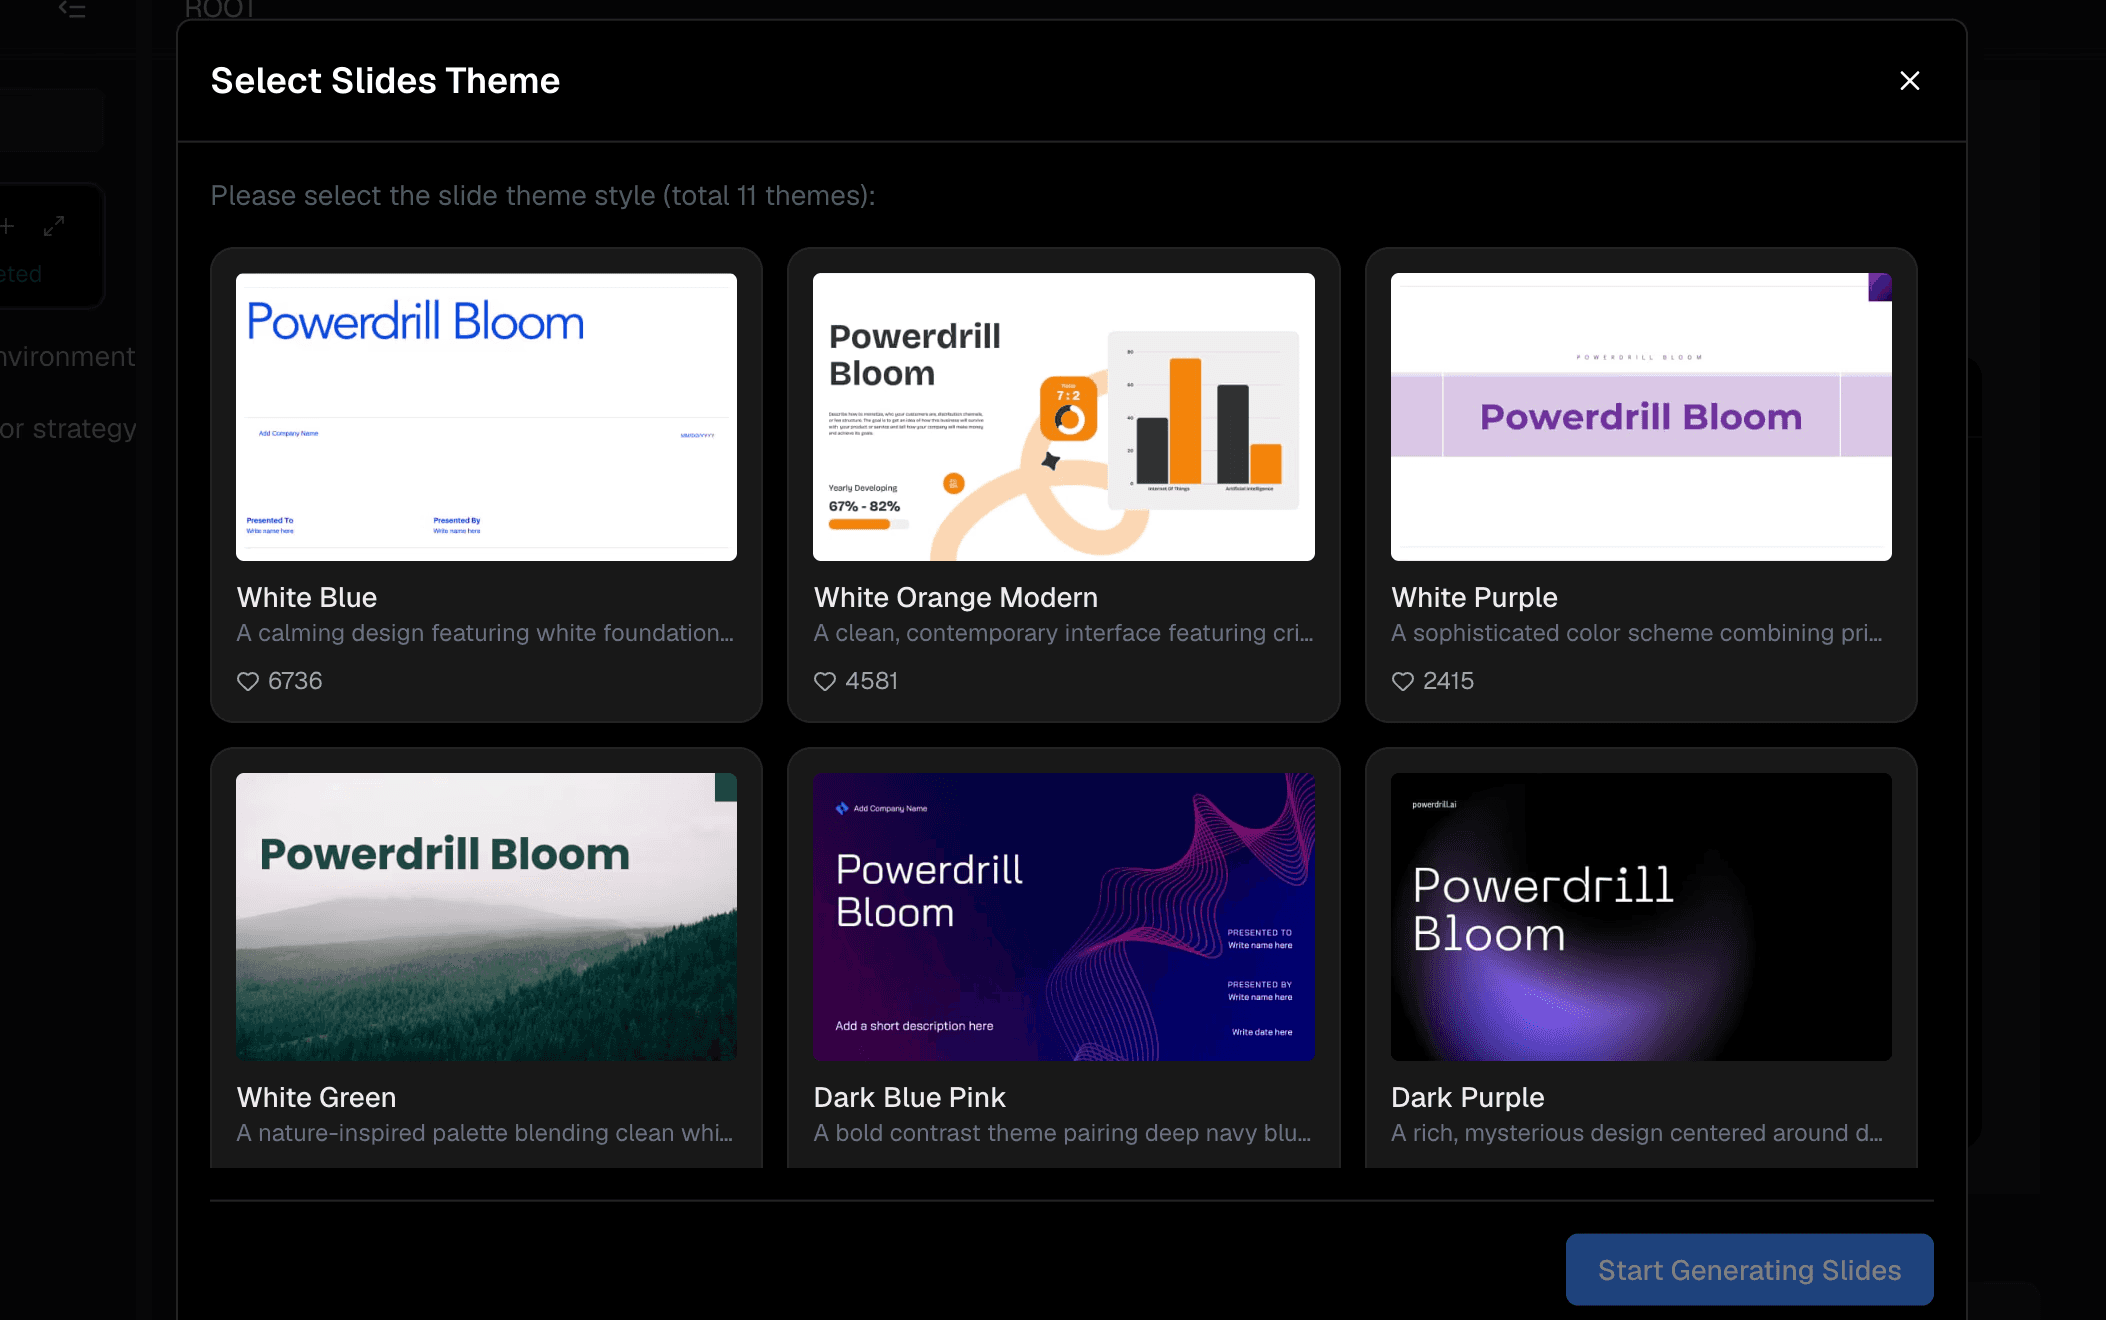
1. Powerdrill Bloom
Powerdrill Bloom is an AI-first collaborative workspace that redefines how investors interact with data. Operating as an intelligent analytical layer, it transforms raw spreadsheets, CSVs into interactive visual mind maps without requiring a single line of SQL or Python.
Key Features: A multi-agent AI system, natural language data querying, dynamic mind-mapping, and instant export capabilities for professional PDF and PPT reports.
Pros: Offers a highly flexible visual workspace instead of static dashboards; features specialized AI agents that handle data cleaning, market benchmarking, and metric verification; requires zero coding.
Cons: Does not feature a direct live blockchain transaction feed; requires users to import their own historical files or connect data via API endpoints.
Pricing: $13.27/month.
2. DeFiLlama
DeFiLlama is one of the largest open-source on-chain data analytics platforms, specializing in tracking Decentralized Finance (DeFi) networks, yield aggregates, and historical protocol TVL (Total Value Locked).
Key Features: Multi-chain TVL tracking, token unlock calendars, yield aggregates, decentralized exchange volumes, and protocol fee trackers.
Pros: Highly reliable, community-verified data with a strict focus on neutrality; completely free to use without paywalls; offers a comprehensive view of capital flows across dozens of ecosystems.
Cons: The interface can be overwhelming for beginners; lacks built-in natural language explanations or automated AI synthesis features.
Pricing: $490/year.
3. CoinGecko
CoinGecko is a major independent cryptocurrency market data aggregator that tracks thousands of active tokens, global market caps, trading volumes, and community engagement.
Key Features: Global cryptocurrency rankings, historical price and volume charts, category filters (e.g., L1, Meme, AI tokens), and a robust developer API.
Pros: Incredibly comprehensive token directory; easy-to-use search and basic filtering options; highly accessible API for developer integrations.
Cons: Focuses primarily on basic market-level data (price, volume, supply) rather than deep transactional on-chain behaviors or custom data-file analysis.
Pricing: $29/month.
4. Nansen
Nansen is a premium blockchain analytics platform that bridges on-chain transactions with real-world entities by labeling over 300 million wallet addresses to track market movements.
Key Features: "Smart Money" flow tracking, real-time transaction alerts, token/chain dashboards, and an integrated non-custodial trading interface.
Pros: Outstanding wallet attribution showing where venture funds and active traders are routing capital; simplifies the process of tracking early token accumulation.
Cons: Heuristics are not always 100% accurate as actors frequently rotate addresses; paid subscriptions represent a significant financial commitment for retail users.
Pricing: $49/month.
5. LunarCrush
LunarCrush is a social intelligence platform designed to monitor and analyze social media sentiment, creator metrics, and community engagement for digital assets.
Key Features: Social Volume and Sentiment scores, creator/influencer performance tracking, custom watchlists, and integration with LLMs via its API.
Pros: Captures public interest and social momentum before it reflects on the price charts; useful for spotting narrative shifts in highly speculative sectors.
Cons: Social metrics are highly susceptible to bot activity and artificial manipulation; does not provide direct financial auditing or raw chain statistics.
Pricing: $5/day.
Step by Step Guide: How to Use Powerdrill Bloom to Spot Crypto Trends
Using Powerdrill Bloom’s unique collaborative canvas, you can systematically analyze complex market datasets to identify emerging trends. Here is a practical workflow to get you started.
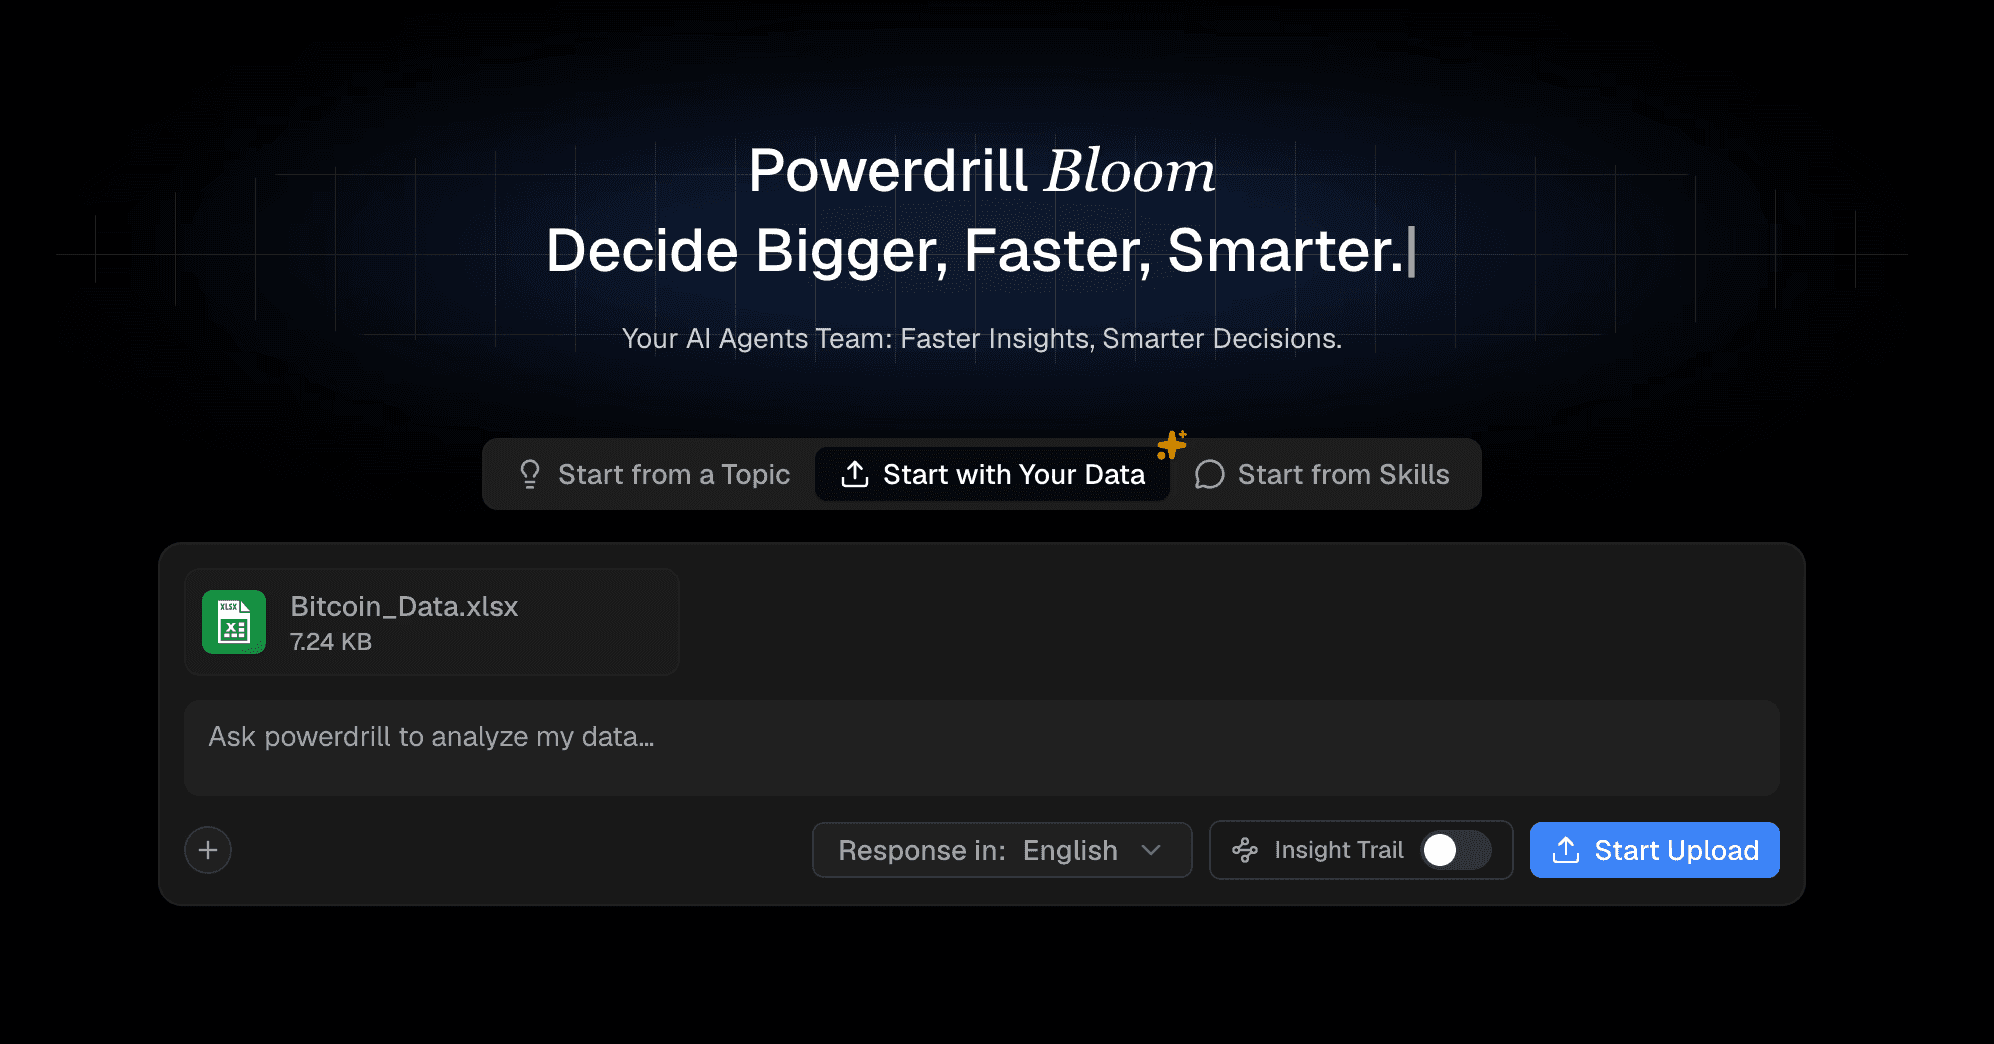
Step 1 - Upload or Connect Data
Drag and drop your CSV or Excel files directly onto the Powerdrill Bloom canvas.
Step 2- Explore the Data
Once your data is structured, Powerdrill Bloom’s canvas transforms the file into an interactive, node-based mind map.
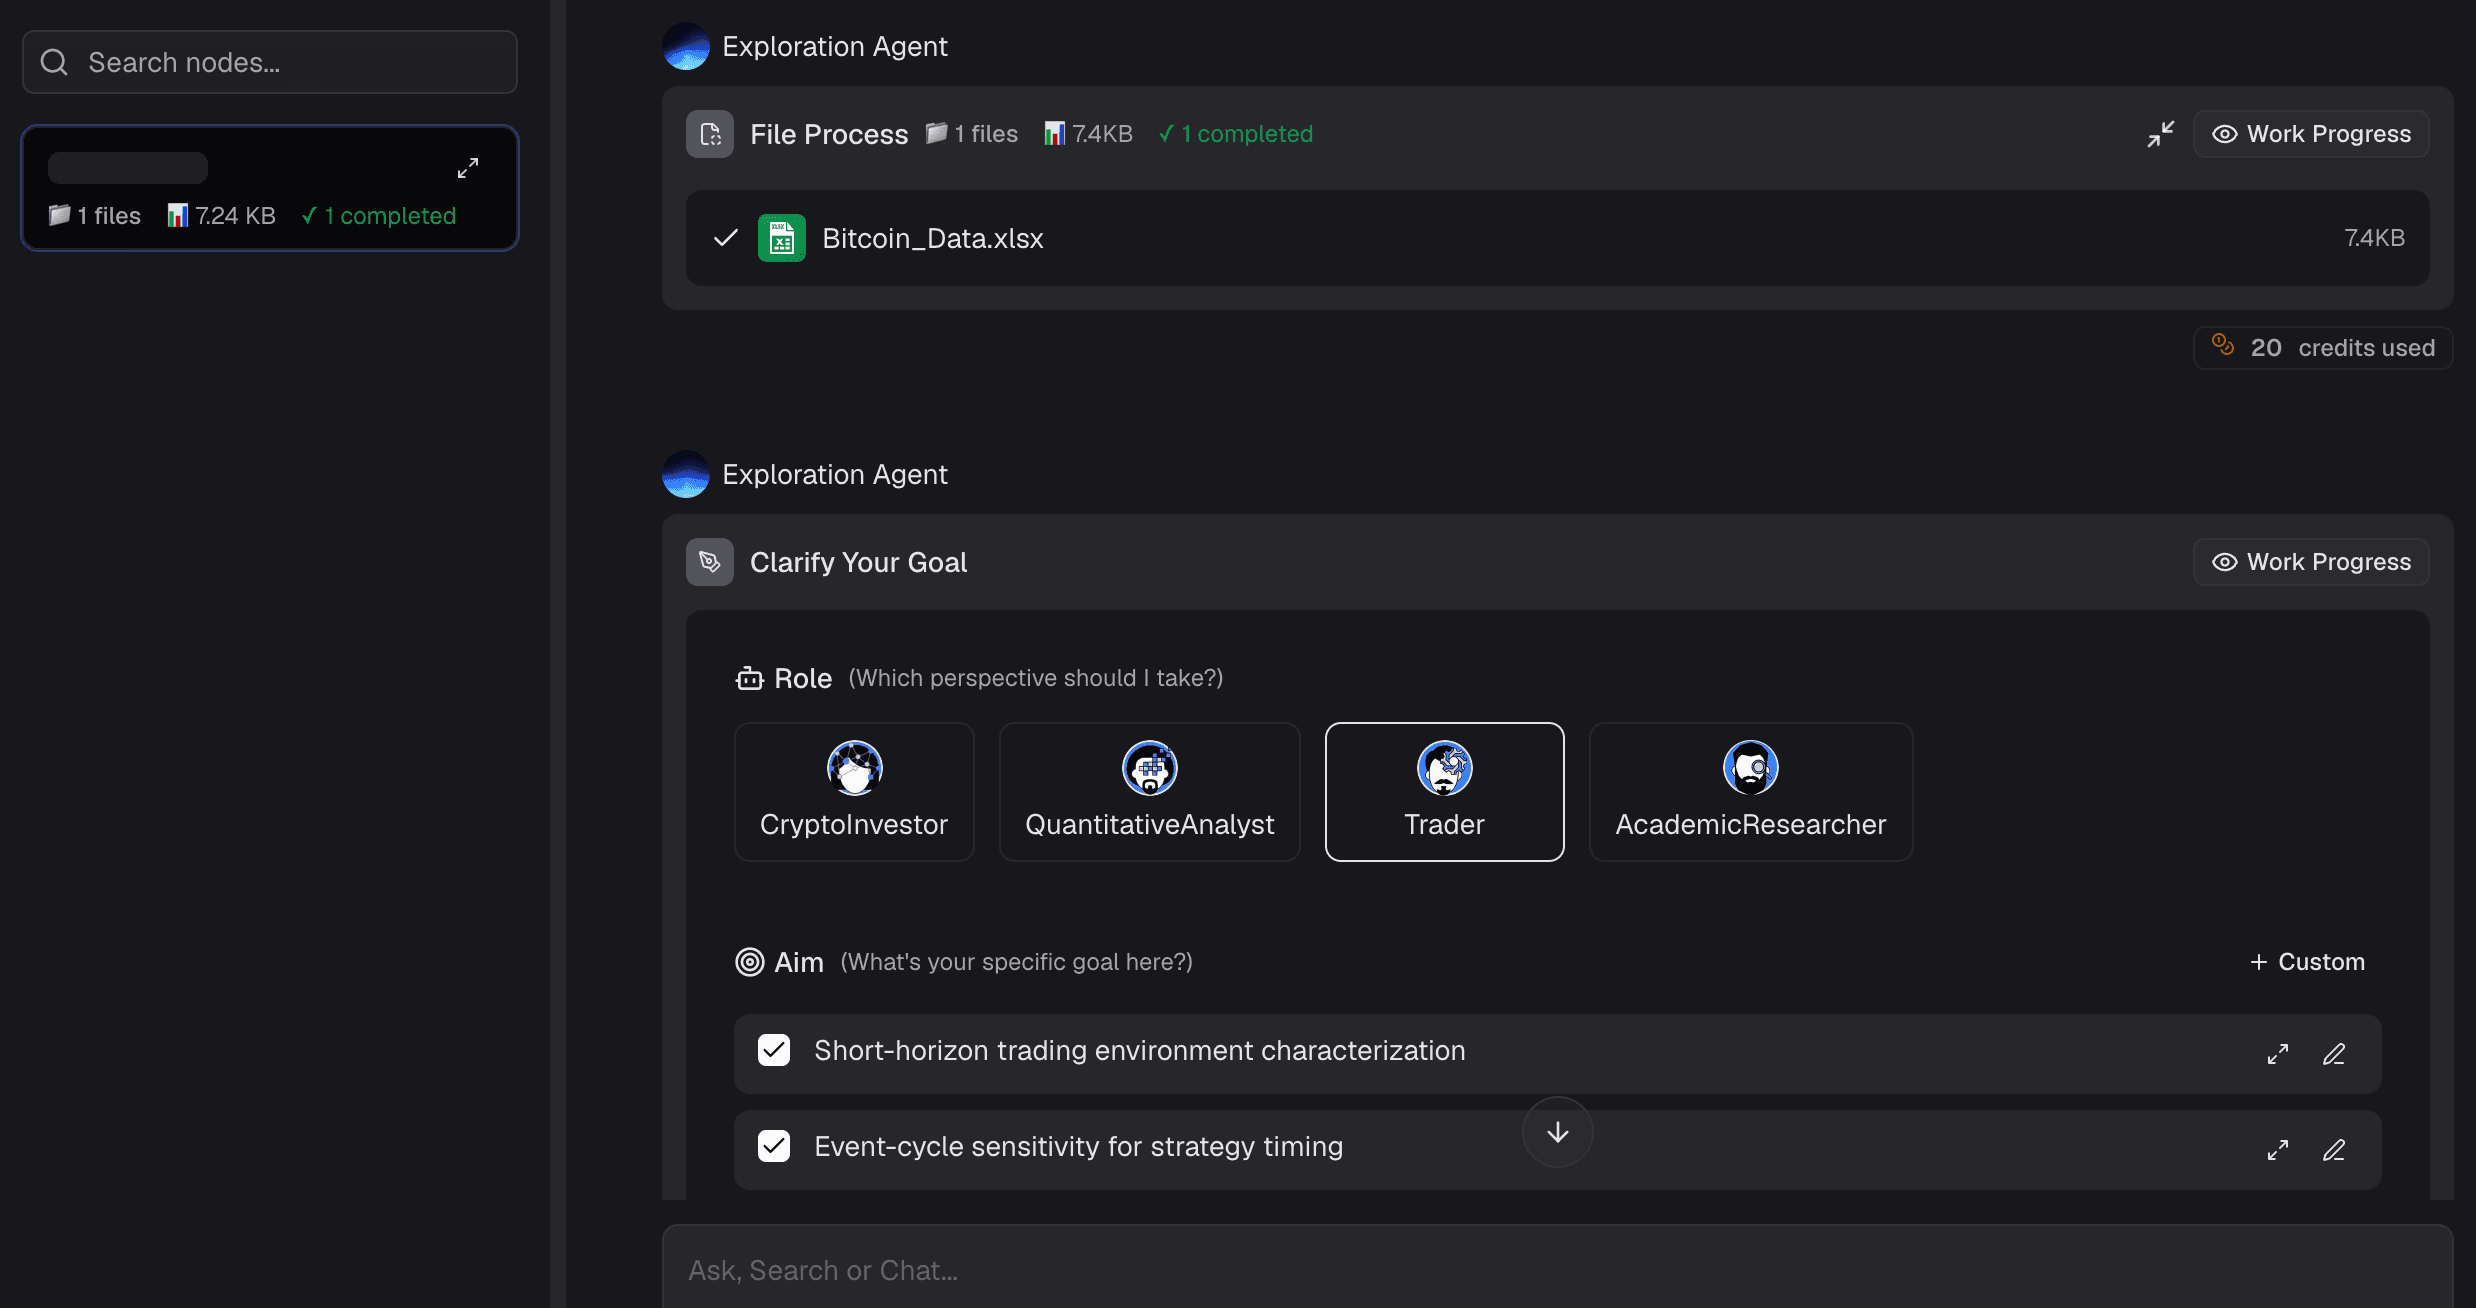
Step 3 - Ask Natural Language Questions
With your mind map established, you can interact with the dataset using natural language. Use the chat interface on your canvas to ask specific questions. The AI will instantly query the source data and present focused visual answers.
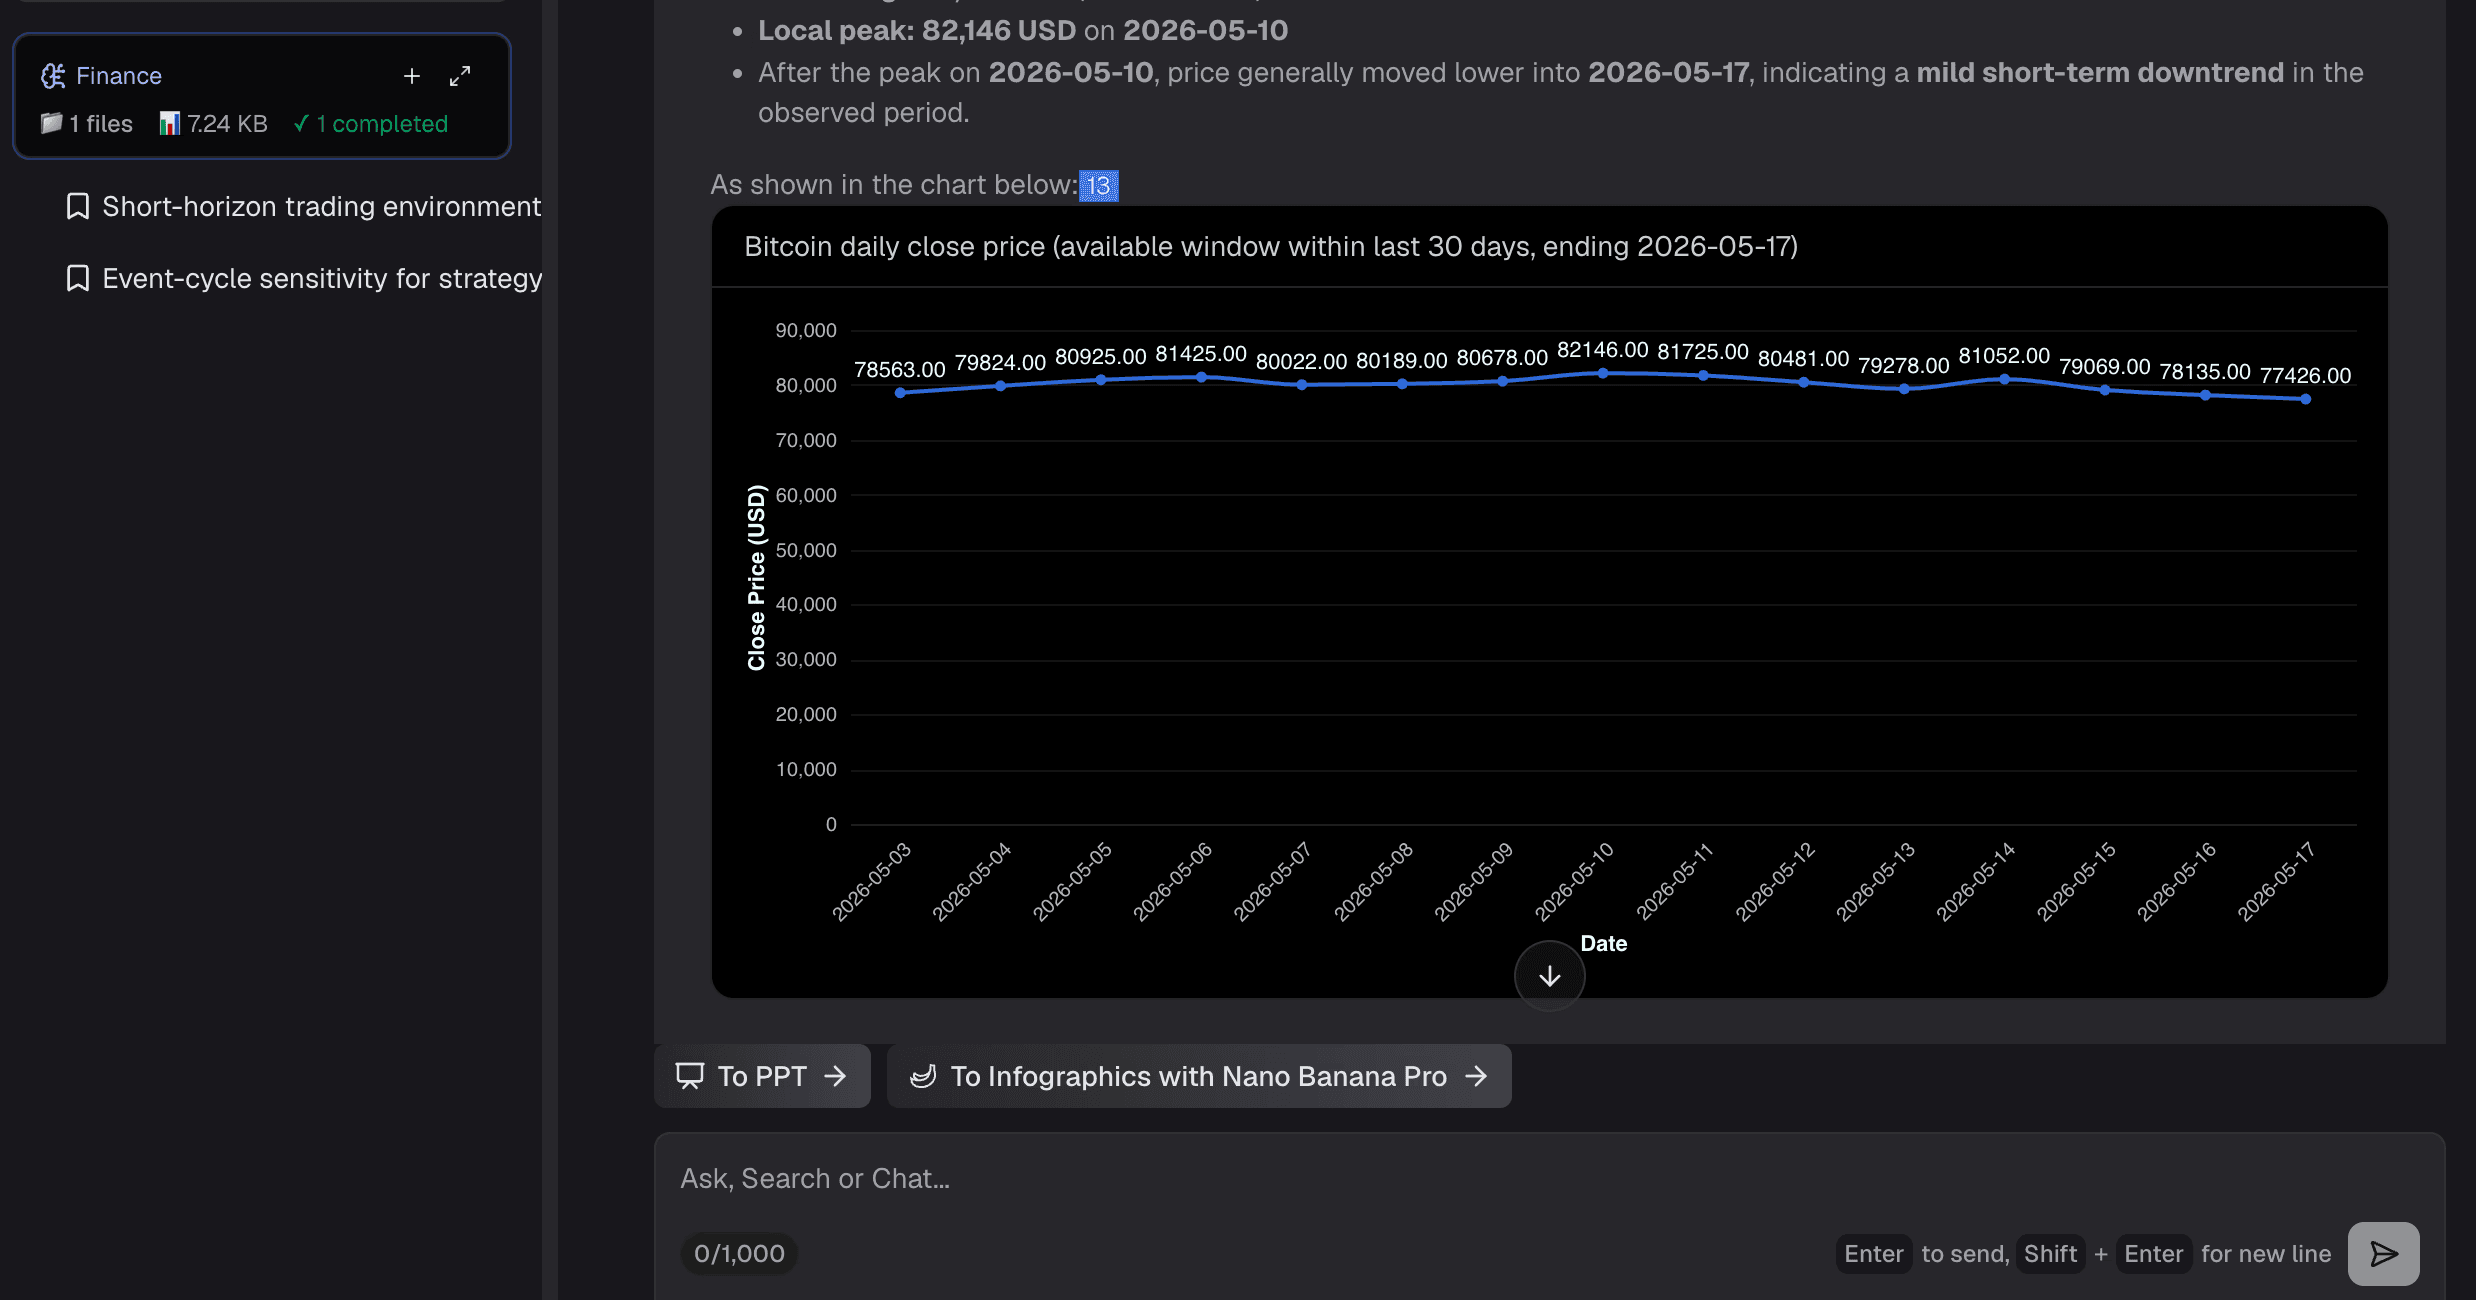
Step 4 - Generate AI-Generated Insights
You can export these findings into a polished PowerPoint report or structured PDF, giving you a reliable document to guide your trading decisions.
AI Can Hallucinate Data — Why Verification Still Matters in Crypto Analysis
While AI tools significantly accelerate data analysis and lower the technical barrier for non-coders, they are not infallible. Large language models can occasionally suffer from "hallucinations", a phenomenon where the AI confidently generates incorrect numbers, invents non-existent correlation trends, or misinterprets context limits.
In the high-stakes environment of cryptocurrency trading, relying on unverified AI summaries can lead to costly mistakes. An incorrect decimal point or a miscalculated yield percentage can significantly alter your risk profile. This is why human oversight and algorithmic verification remain essential.
While Powerdrill Bloom mitigates this risk by employing specialized agents like Victor the Verifier to double-check formulas and source files, analysts must still approach AI-generated outputs with a critical eye. Always cross-verify critical metrics against primary sources, such as raw block explorers or official protocol documentations, before executing trades or deploying capital.
Conclusion
Spotting cryptocurrency trends in 2026 demands a structured approach to managing data overload. While traditional tools like CoinGecko and DeFiLlama provide essential raw data, combining them with AI-powered analytics allows you to parse that data much faster. By integrating structured files with a collaborative workspace, you can transform complex metrics into clear, actionable charts and reports.
To see how an interactive AI canvas can streamline your research workflow and help you discover deeper insights, explore what the platform has to offer. Try Powerdrill Bloom today to start analyzing your market data with intelligent AI agents.
FAQs
How does Powerdrill Bloom process large crypto datasets?
It cleans and organizes raw CSV or Excel data using specialized AI agents, presenting it visually on an interactive canvas.
Can Nansen track memecoin trades on Solana?
Yes, Nansen supports Solana tracking, allowing users to monitor real-time wallet transactions, DEX trades, and smart money movement for free.
What makes LunarCrush different from traditional analytics tools?
Rather than tracking price charts, LunarCrush analyzes social media volume, creator activity, and public sentiment to measure market hype.
Why do AI agents in Powerdrill Bloom improve analysis?
They split complex tasks like structuring, analyzing, and cross-verifying data among specialized entities, reducing manual errors and saving time.