How to Generate an Executive Summary From Raw Business Data (Beginner-Friendly)
We live in an era where businesses are practically swimming in data. Every click, every sale, and every customer interaction is meticulously tracked, logged, and stored. However, a massive pile of numbers is just that—a pile of numbers. Having access to infinite amounts of information does not automatically equate to having deep business intelligence. The true challenge that modern professionals face is bridging the gap between collecting massive datasets and extracting the meaningful, strategic insights hidden within them.
Stakeholders, managers, and clients simply do not have the time to sift through thousands of spreadsheet rows to figure out what is happening. They need the bottom line, delivered quickly and clearly. This is exactly where an executive summary becomes your most powerful communication tool.
In this comprehensive, beginner-friendly guide, we will explore exactly how you can easily transform your overwhelming, raw business datasets into a polished, compelling, and highly readable executive summary using the power of modern artificial intelligence.
Why Raw Business Data Isn't Enough
You might be wondering why you cannot just send a highly detailed Excel spreadsheet to your boss or your clients and let them figure it out. The reality is that raw business data is inherently flawed when it comes to communication. First and foremost, raw data causes severe cognitive overload. When confronted with thousands of interconnected cells, columns, and numerical values, the human brain struggles to immediately identify what is important and what is merely background noise.
Furthermore, raw data completely lacks storytelling. Numbers alone cannot explain why a sudden drop in sales occurred in the third quarter, nor can they intuitively highlight the incredible success of a recent marketing campaign. Without a narrative wrapping around the numbers, your audience is left guessing about the context.
Finally, raw data severely delays the decision-making process. Business leaders rely on speed. If a CEO has to spend three hours manually analyzing a pivot table just to understand the current financial health of the company, that is three hours lost that could have been spent taking action. Raw data is simply the raw ingredient; an executive summary is the fully cooked, ready-to-eat meal that drives immediate business action.
What Makes a Good AI-Generated Executive Summary
When you leverage artificial intelligence to summarize your data, you want to ensure the output is actually useful. A good AI-generated executive summary should possess the following key characteristics:
Absolute Clarity and Brevity: It must strip away all the unnecessary fluff. A high-quality summary gets straight to the point, highlighting only the most critical metrics and outcomes without overwhelming the reader with secondary details.
Actionable Insights: It shouldn't just state what happened; it should hint at what needs to be done next. Good summaries translate historical data into forward-looking recommendations.
Accurate Data Representation: It must be completely free of "hallucinations." The summary must accurately reflect the numbers provided in the source dataset without making up facts or misinterpreting figures.
Contextual Storytelling: It needs to weave the disconnected data points into a cohesive narrative, explaining the relationship between different metrics (e.g., how an increase in ad spend directly impacted the customer acquisition cost).
Audience-Tailored Tone: A strong summary uses professional language suited for C-suite executives, avoiding overly technical jargon unless absolutely necessary for the specific audience.
How to Generate an Executive Summary From Raw Business Data
You do not need to be a data scientist or a programming expert to turn your data into a masterpiece. By following these simple steps, anyone can master this workflow.
Step 1: Upload Your Business Data
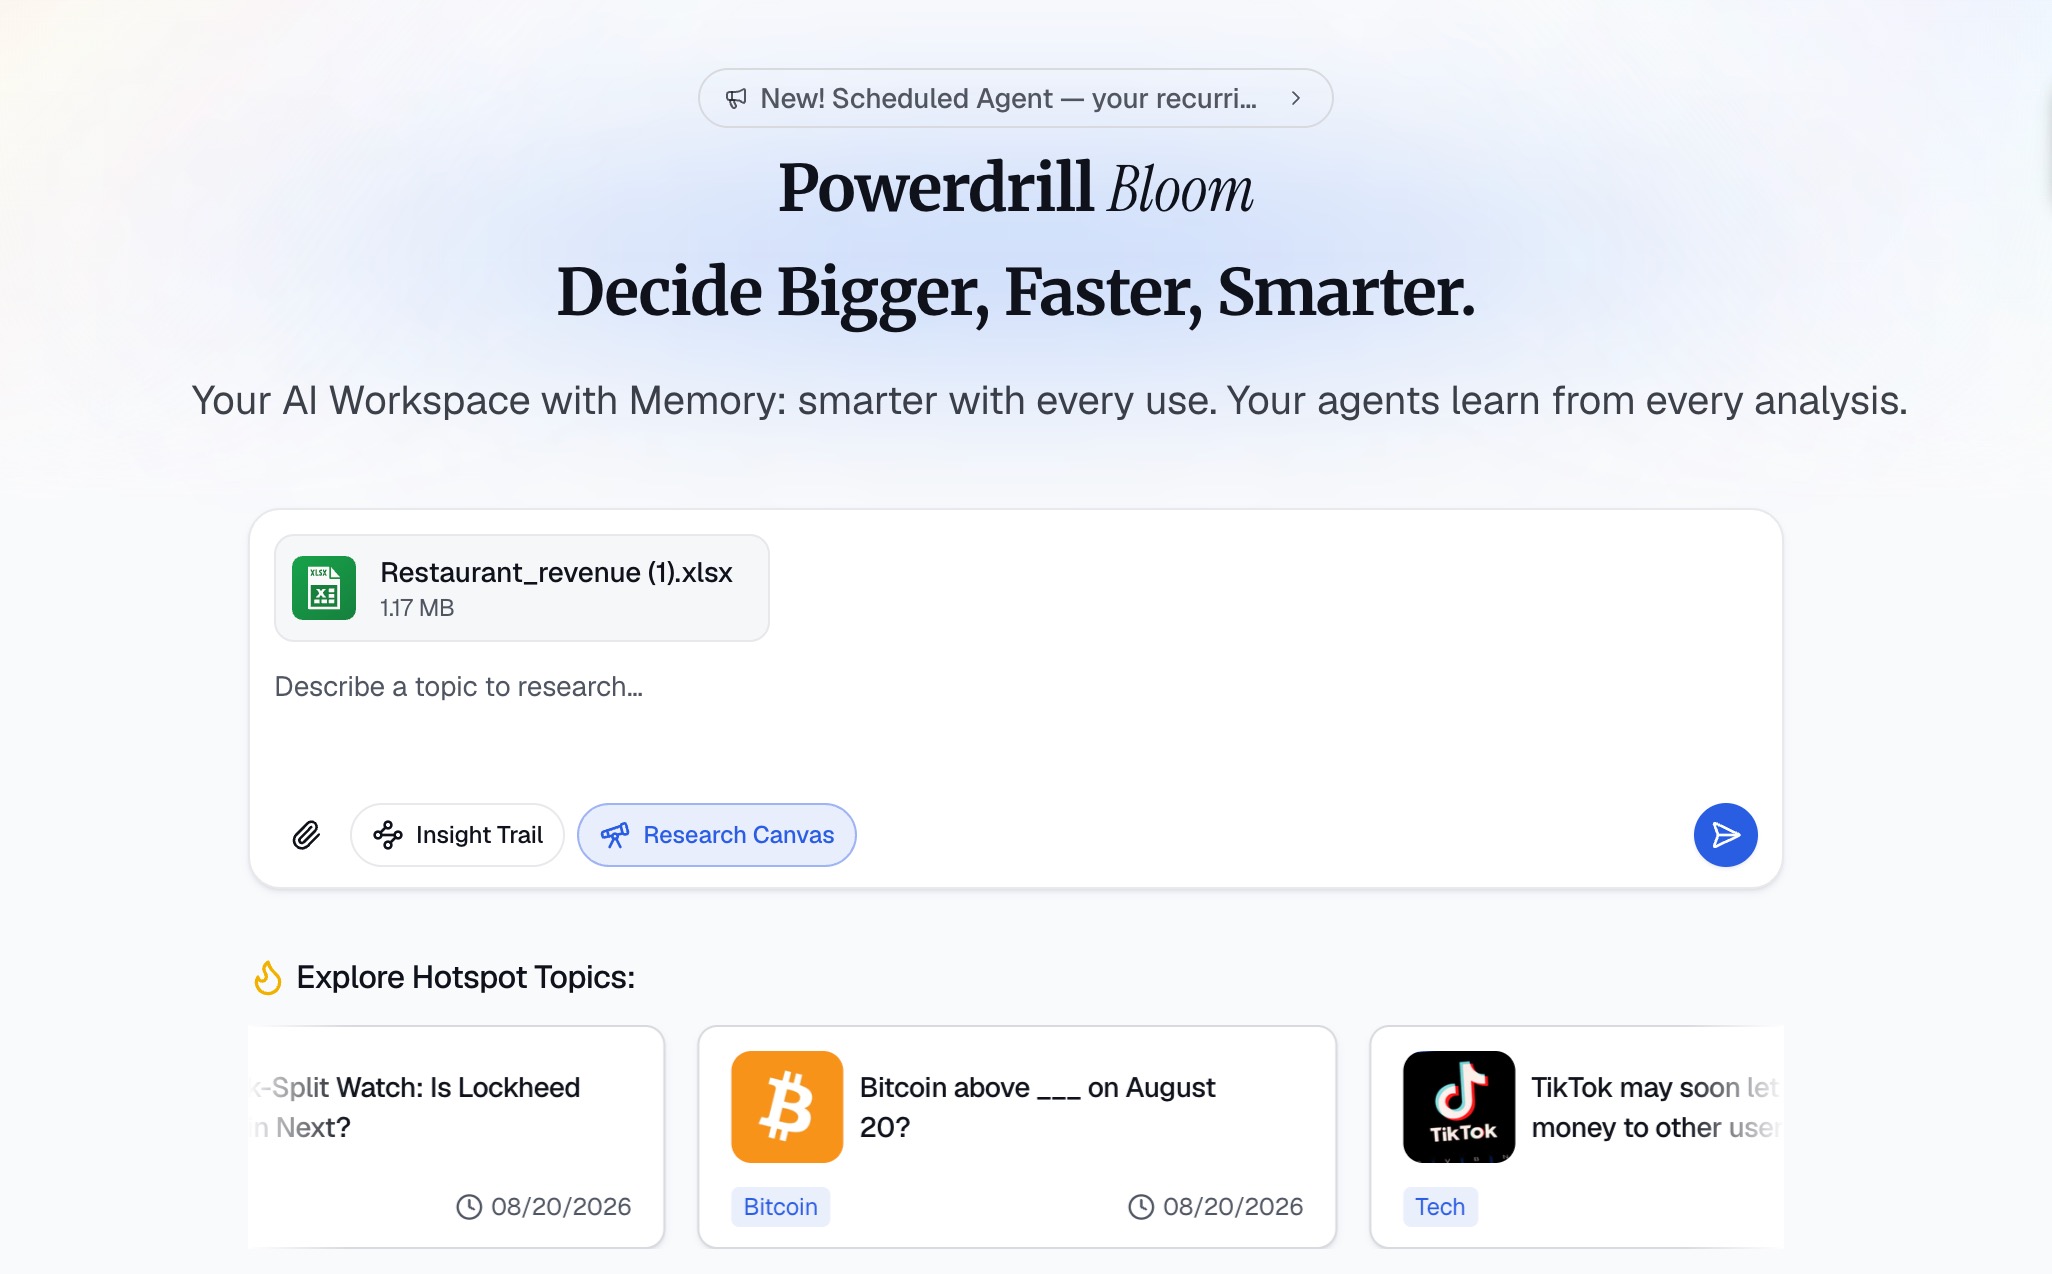
The first step is to simply upload your business file directly to the AI analysis platform. Whether it’s a CSV or Excel file, modern AI tools intelligently read the file structure, automatically recognizing headers and data columns. There’s no need to manually clean or organize the spreadsheet beforehand—just select your file, hit upload, and the system will securely and quickly import the data, preparing it for deep analysis.
Step 2: Ask AI to Analyze the Data
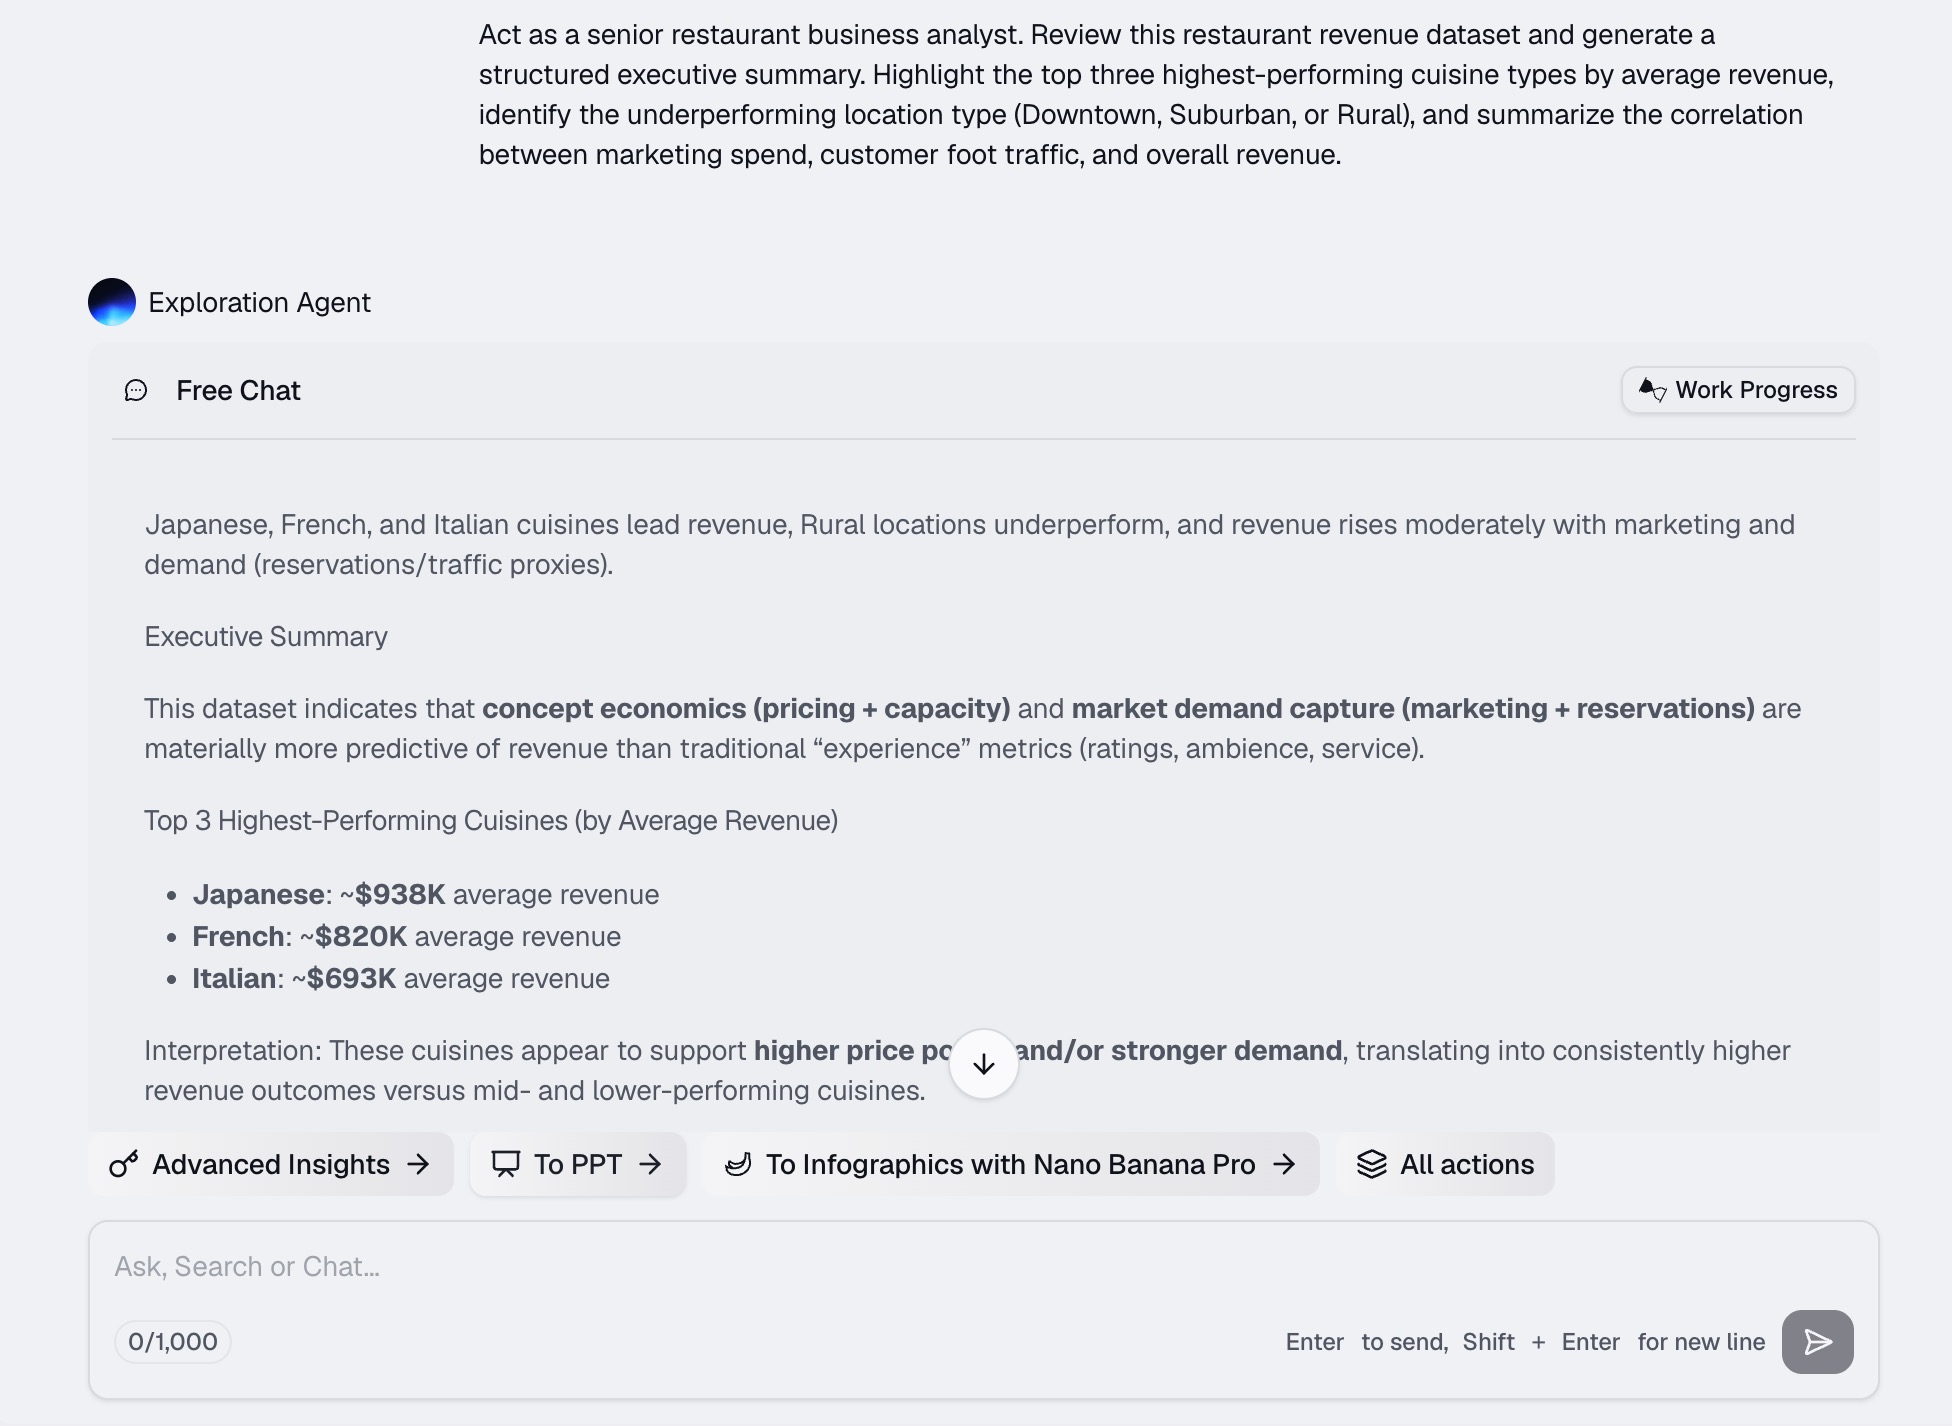
This is where the magic happens, and it all comes down to how you prompt the AI. You need to treat the AI like a junior data analyst. For example, you might type: "Act as a senior restaurant business analyst. Review this restaurant revenue dataset and generate a structured executive summary. Highlight the top three highest-performing cuisine types by average revenue, identify the underperforming location type (Downtown, Suburban, or Rural), and summarize the correlation between marketing spend, customer foot traffic, and overall revenue." The more specific you are about what you want to see, the better the final output will be.
Step 3: Generate Visualizations
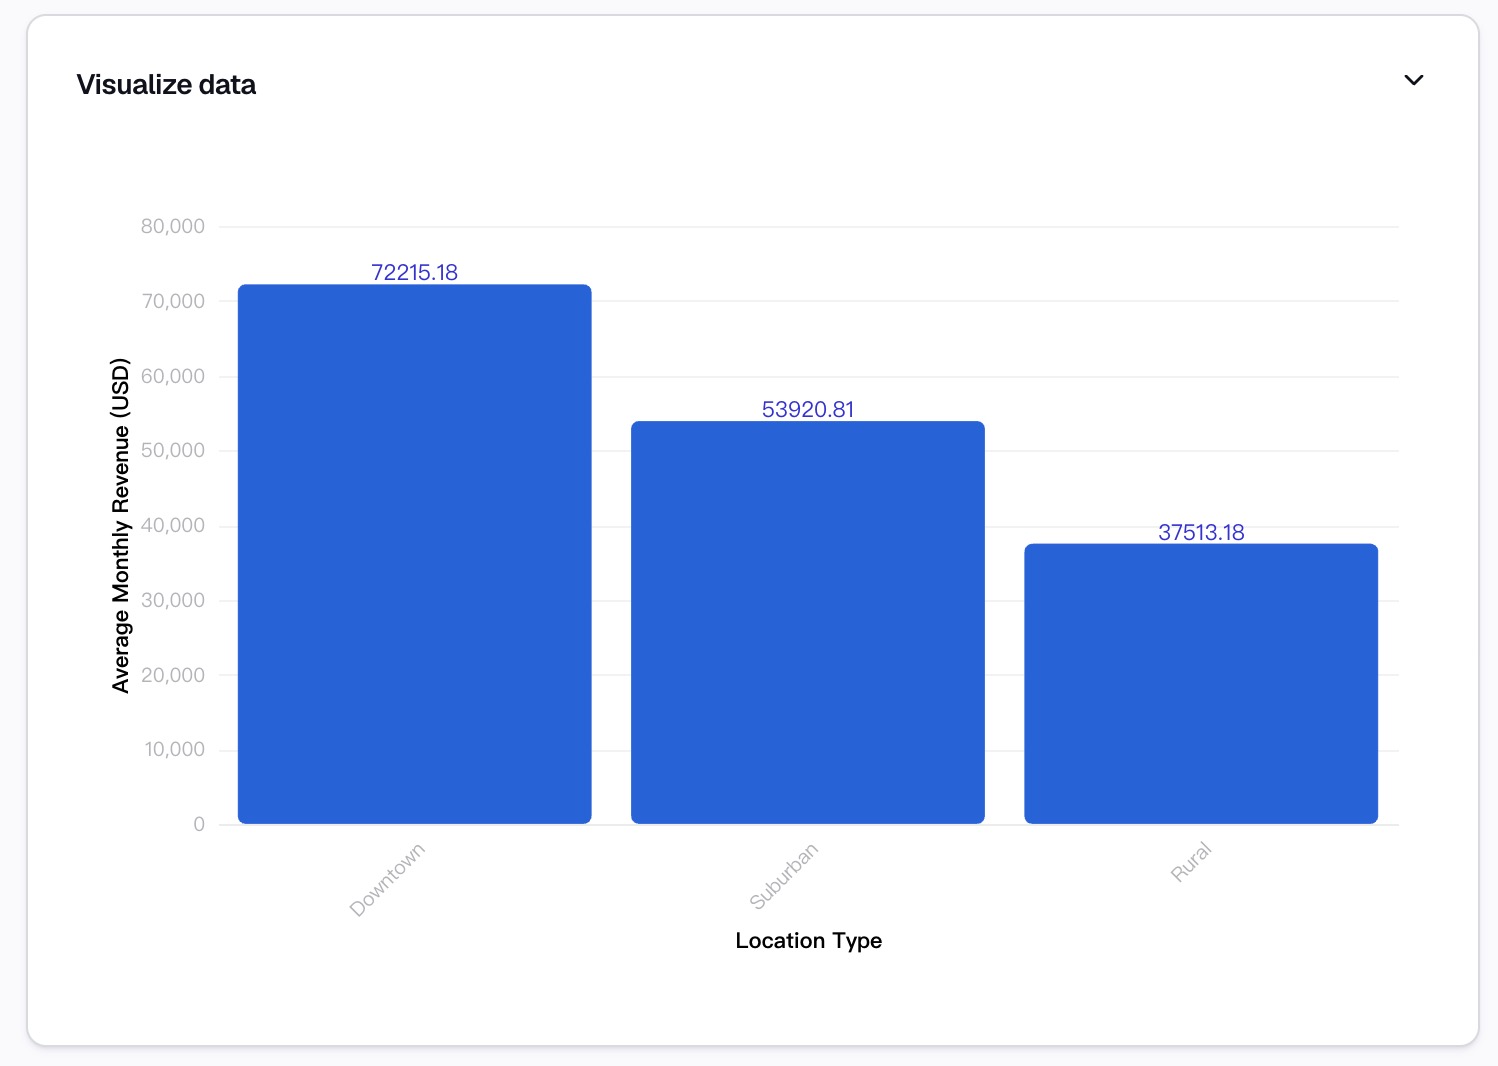
An executive summary is vastly improved when text is supported by visuals. No one wants to read a giant wall of text. Ask the AI to generate charts to complement the narrative. You can prompt it by saying, "Create a bar chart comparing the average monthly revenue across different location types (Downtown, Suburban, Rural).," or "Generate a scatter plot showing the correlation between customer ratings and revenue, with point sizes representing seating capacity." Placing these visual aids next to your text allows stakeholders to grasp complex trends in a matter of seconds.
Step 4: Review and Export the Report
Never blindly copy and paste AI-generated content. You must always keep a "human in the loop." Read through the generated executive summary carefully. Does the tone match your company's style? Did the AI correctly interpret the nuances of your industry? Cross-check a few key figures with your original spreadsheet to ensure total accuracy. Once you are satisfied with the narrative and the visuals, export the final document as a clean PDF or Word document, ready to be presented in your next big meeting.
Before vs. After: From Spreadsheet to Executive Summary
To truly understand the value of this transformation, look at the stark contrast between raw data and a finished executive summary. The table below illustrates exactly how the experience shifts for the end-user.
| Feature | Raw Spreadsheet Data | AI-Generated Executive Summary |
|---|---|---|
| Format | Endless rows, columns, and disconnected cells. | Clear paragraphs, bullet points, and charts. |
| Time to Comprehend | Hours of manual sorting, filtering, and reading. | Minutes of quick, high-level scanning. |
| Focus | Micro-details (individual transactions, daily stats). | Macro-trends (overall growth, major red flags). |
| Target Audience | Data analysts, accountants, and engineers. | CEOs, stakeholders, and department managers. |
| Actionability | Low (requires extensive interpretation first). | High (provides direct insights and next steps). |
Conclusion
Transforming raw business data into a polished executive summary is no longer a tedious, time-consuming chore that requires advanced analytical skills. By leveraging the right technology, you can elevate your data from a confusing jumble of numbers into a clear, persuasive, and highly actionable story. If you are ready to stop wrestling with complex spreadsheets and start generating incredible insights in seconds, you need the right tool for the job. We highly recommend you check out Powerdrill Bloom. It is incredibly user-friendly, highly secure, and designed specifically to help beginners turn their raw datasets into stunning executive summaries effortlessly. Try Powerdrill Bloom today and revolutionize the way you present your business data.
FAQs
1. What is an executive summary?
It is a concise overview of a larger report, highlighting key findings, metrics, and actionable recommendations for decision-makers.
2. Can AI keep my business data secure?
Yes, reputable AI tools prioritize data privacy through encryption. Always review their specific data retention and security policies beforehand.
3. What file formats work best for AI analysis?
Spreadsheets like CSV or Excel files are ideal because they provide structured, easily readable data for AI processing algorithms.
4. Do I need coding skills to use AI data tools?
Not at all. Modern platforms feature intuitive, conversational interfaces designed specifically for beginners without any programming background or expertise.
5. How accurate are AI-generated summaries?
They are highly accurate with clean data, but you must always perform a quick human review to verify contextual accuracy.