How to Forecast Next Quarter's Sales From Historical Excel Data (Easy Method)

Forecasting next quarter’s sales is one of the most critical tasks for any business owner, sales manager, or financial analyst. An accurate forecast allows you to manage inventory effectively, allocate marketing budgets, set realistic performance targets for your team, and maintain healthy cash flow. However, for decades, predicting future sales has been a tedious, highly technical, and often frustrating process. If you have ever stared at a massive Excel spreadsheet filled with thousands of rows of historical data, wondering how to turn those numbers into a reliable prediction, you are not alone.
Traditionally, forecasting required advanced knowledge of complex mathematical formulas, statistical modeling, and confusing spreadsheet functions like FORECAST.ETS or linear regression analysis. A single wrong keystroke or a misplaced comma could completely ruin your projections, leading to disastrous business decisions. Fortunately, technology has evolved. Today, you no longer need a degree in data science to accurately predict your business’s future revenue. In this comprehensive guide, we will explore exactly what you need to prepare, common pitfalls to avoid, and the easiest, most modern method to forecast next quarter’s sales using AI-powered tools like Powerdrill Bloom.
What You Need to Forecast Next Quarter's Sales
Before you can predict the future, you must have a solid grasp of the past. To ensure your forecast is as accurate and reliable as possible, you will need a few foundational elements in place. Here is a breakdown of what you need to gather before beginning your sales forecast:
Clean and Structured Historical Data: This is the absolute foundation of any forecast. You need an Excel spreadsheet containing past sales records. Ideally, this data should be organized logically, with clear column headers (e.g., "Date," "Product ID," "Units Sold," "Revenue"). Remove any duplicate entries or irrelevant columns that might confuse the analysis.
A Sufficient Time Horizon: Predicting the next three months requires more than just last month's data. To account for trends and seasonal fluctuations, you should ideally have at least 12 to 24 months of historical sales data. The more history you provide, the better your forecasting tool can identify long-term patterns.
Consistent Time Intervals: Your historical data must be recorded in uniform time increments. Whether you track your sales daily, weekly, or monthly, the intervals must remain consistent throughout your dataset. Mixing daily data for one quarter and monthly data for another will inevitably skew your results.
Context on External Variables: Sales do not happen in a vacuum. It is highly beneficial to have data or notes regarding external factors that influenced past sales. Did you run a massive discount campaign last Black Friday? Did a supply chain disruption cause a dip in inventory? Knowing these variables helps contextualize sudden spikes or drops in your historical data.
A Clear Business Objective: Are you trying to forecast gross revenue, net profit, or total unit volume? Defining your specific goal beforehand ensures you are extracting the right insights from your Excel data, allowing you to make strategic business decisions based on the outcome.
The Easy Way: Forecast Sales With Powerdrill Bloom
For years, professionals relied solely on Excel’s native forecasting features. While powerful, these built-in tools can be incredibly rigid and difficult for non-technical users to master. This is where artificial intelligence steps in to revolutionize the process.
The easiest and most efficient way to forecast next quarter's sales is by leveraging Powerdrill Bloom. Powerdrill Bloom is an advanced, AI-driven data analysis assistant designed specifically to bridge the gap between complex datasets and everyday business users. Instead of forcing you to build intricate mathematical models or write complicated formulas, Powerdrill Bloom acts like a virtual data scientist. It analyzes your historical data, identifies hidden trends, and generates accurate predictive models—all through a highly intuitive, user-friendly interface. By utilizing this AI-powered platform, you can transform hours of manual spreadsheet labor into a task that takes just a few minutes.
Below is a step-by-step guide on how to use Powerdrill Bloom to generate your next-quarter sales forecast effortlessly.
Step 1: Upload the Excel File to Powerdrill Bloom
The first step is as simple as attaching a document to an email. Once you have prepared and cleaned your historical sales data, log into your Powerdrill Bloom account. Navigate to the main dashboard, where you will find an option to start a new data analysis project.
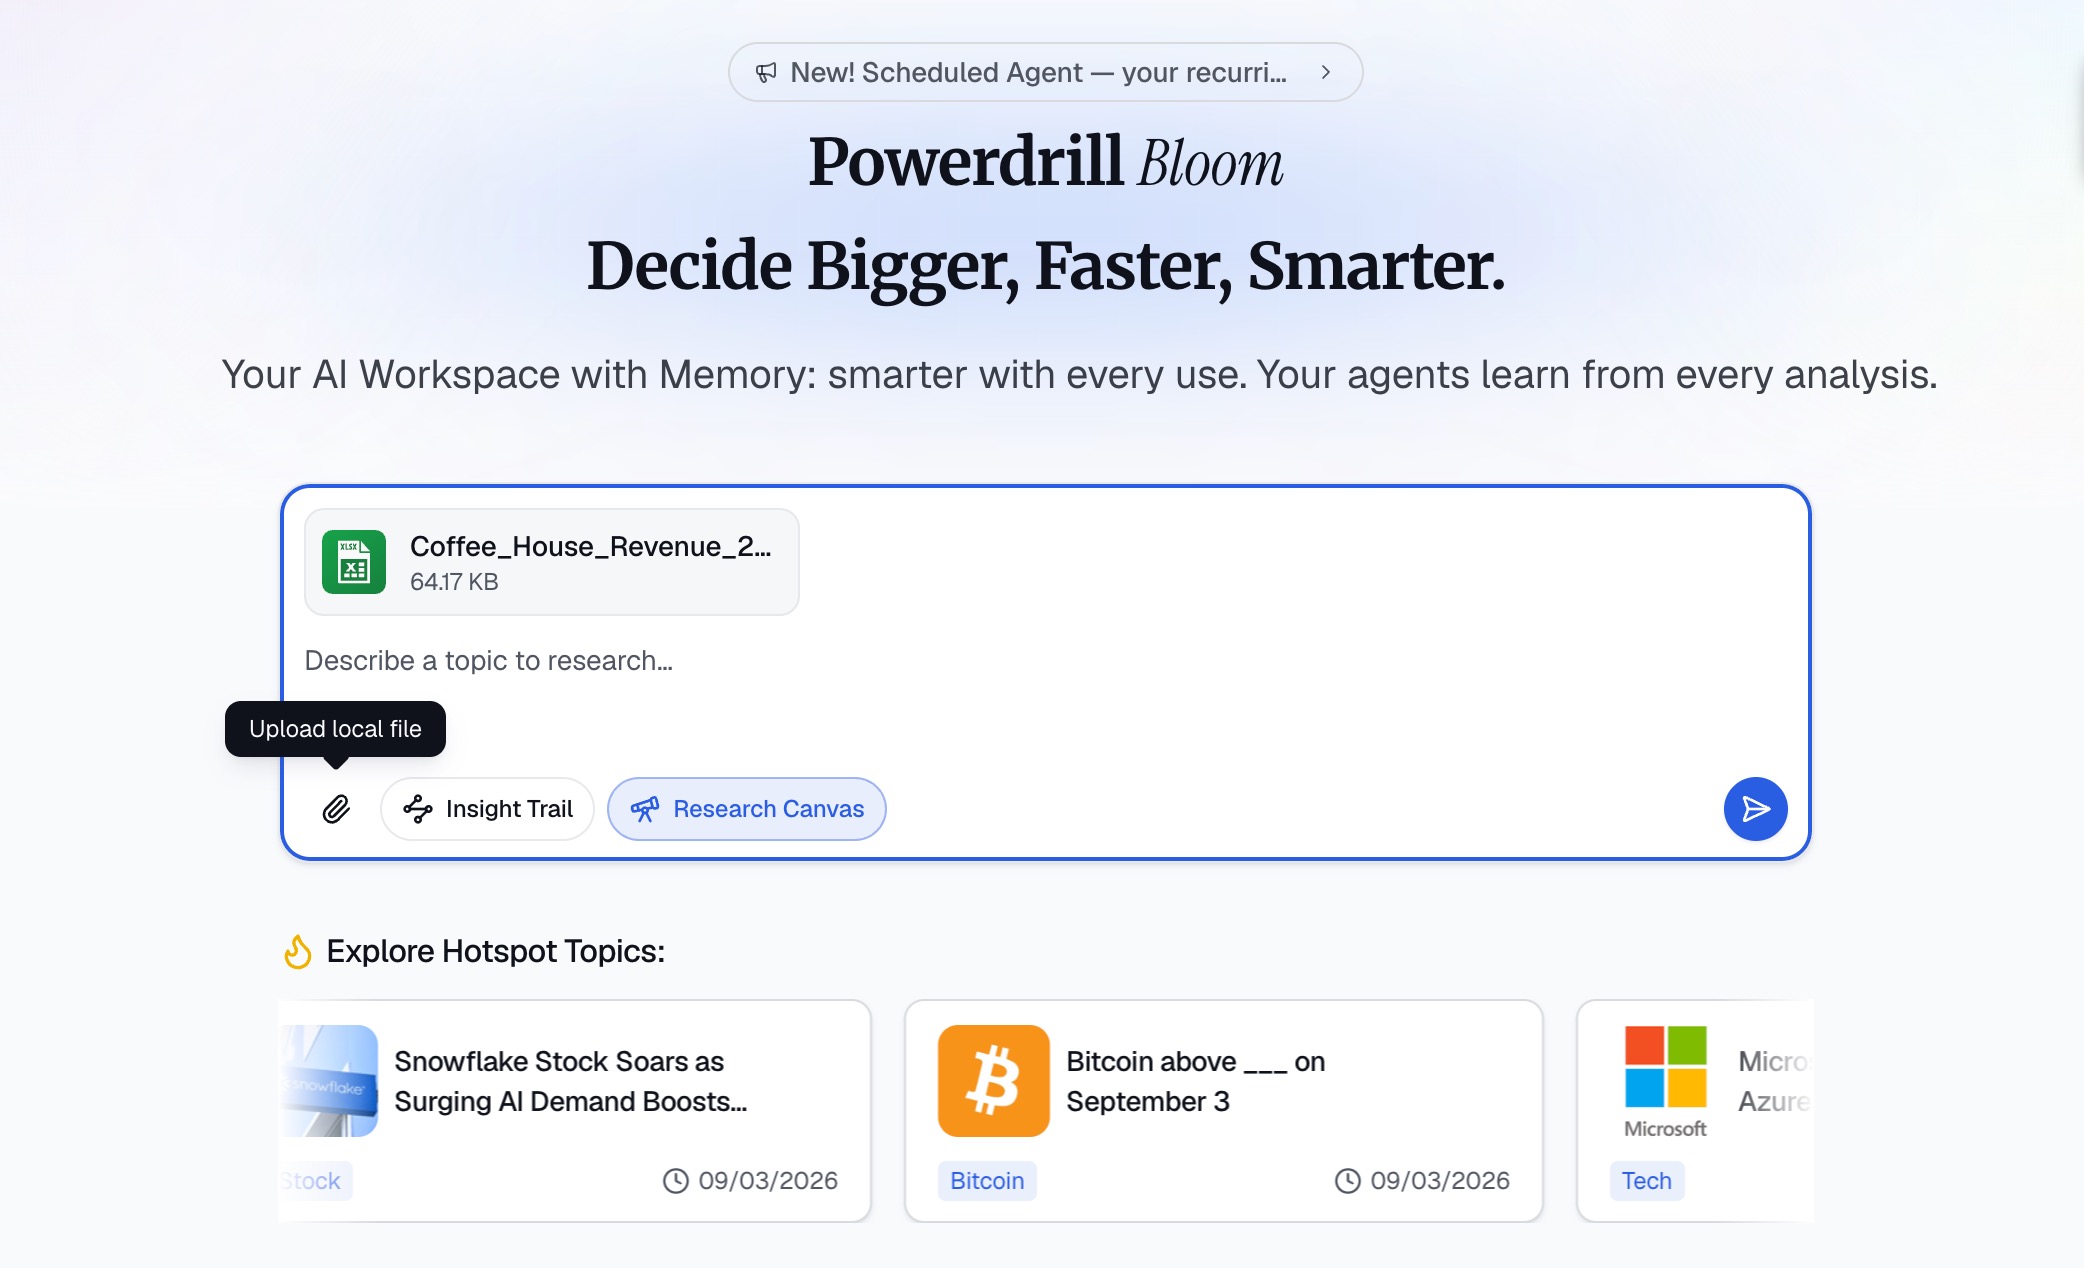
Simply drag and drop your Excel file (whether it is an .XLSX or a .CSV format) directly into the platform's upload zone. Powerdrill Bloom is designed to handle large datasets effortlessly, so you don't have to worry about your browser crashing if you have tens of thousands of rows of transactions. Upon upload, the AI instantly scans your document, recognizing column headers, categorizing data types (such as dates, currencies, and text), and organizing the information into an easy-to-read, interactive format. Security is also a top priority; your proprietary business data remains strictly confidential and protected by enterprise-grade encryption during the entire process.
Step 2: Clarify Your Goal and Choose a Role
Once your data is uploaded, Powerdrill Bloom’s Exploration Agent prompts you to "Clarify Your Goal." This step is incredibly intuitive because you first select a specific professional identity for the AI to adopt. You can choose from tailored roles like a Market Analyst, Sales Manager, Marketing Strategist, or Business Executive.
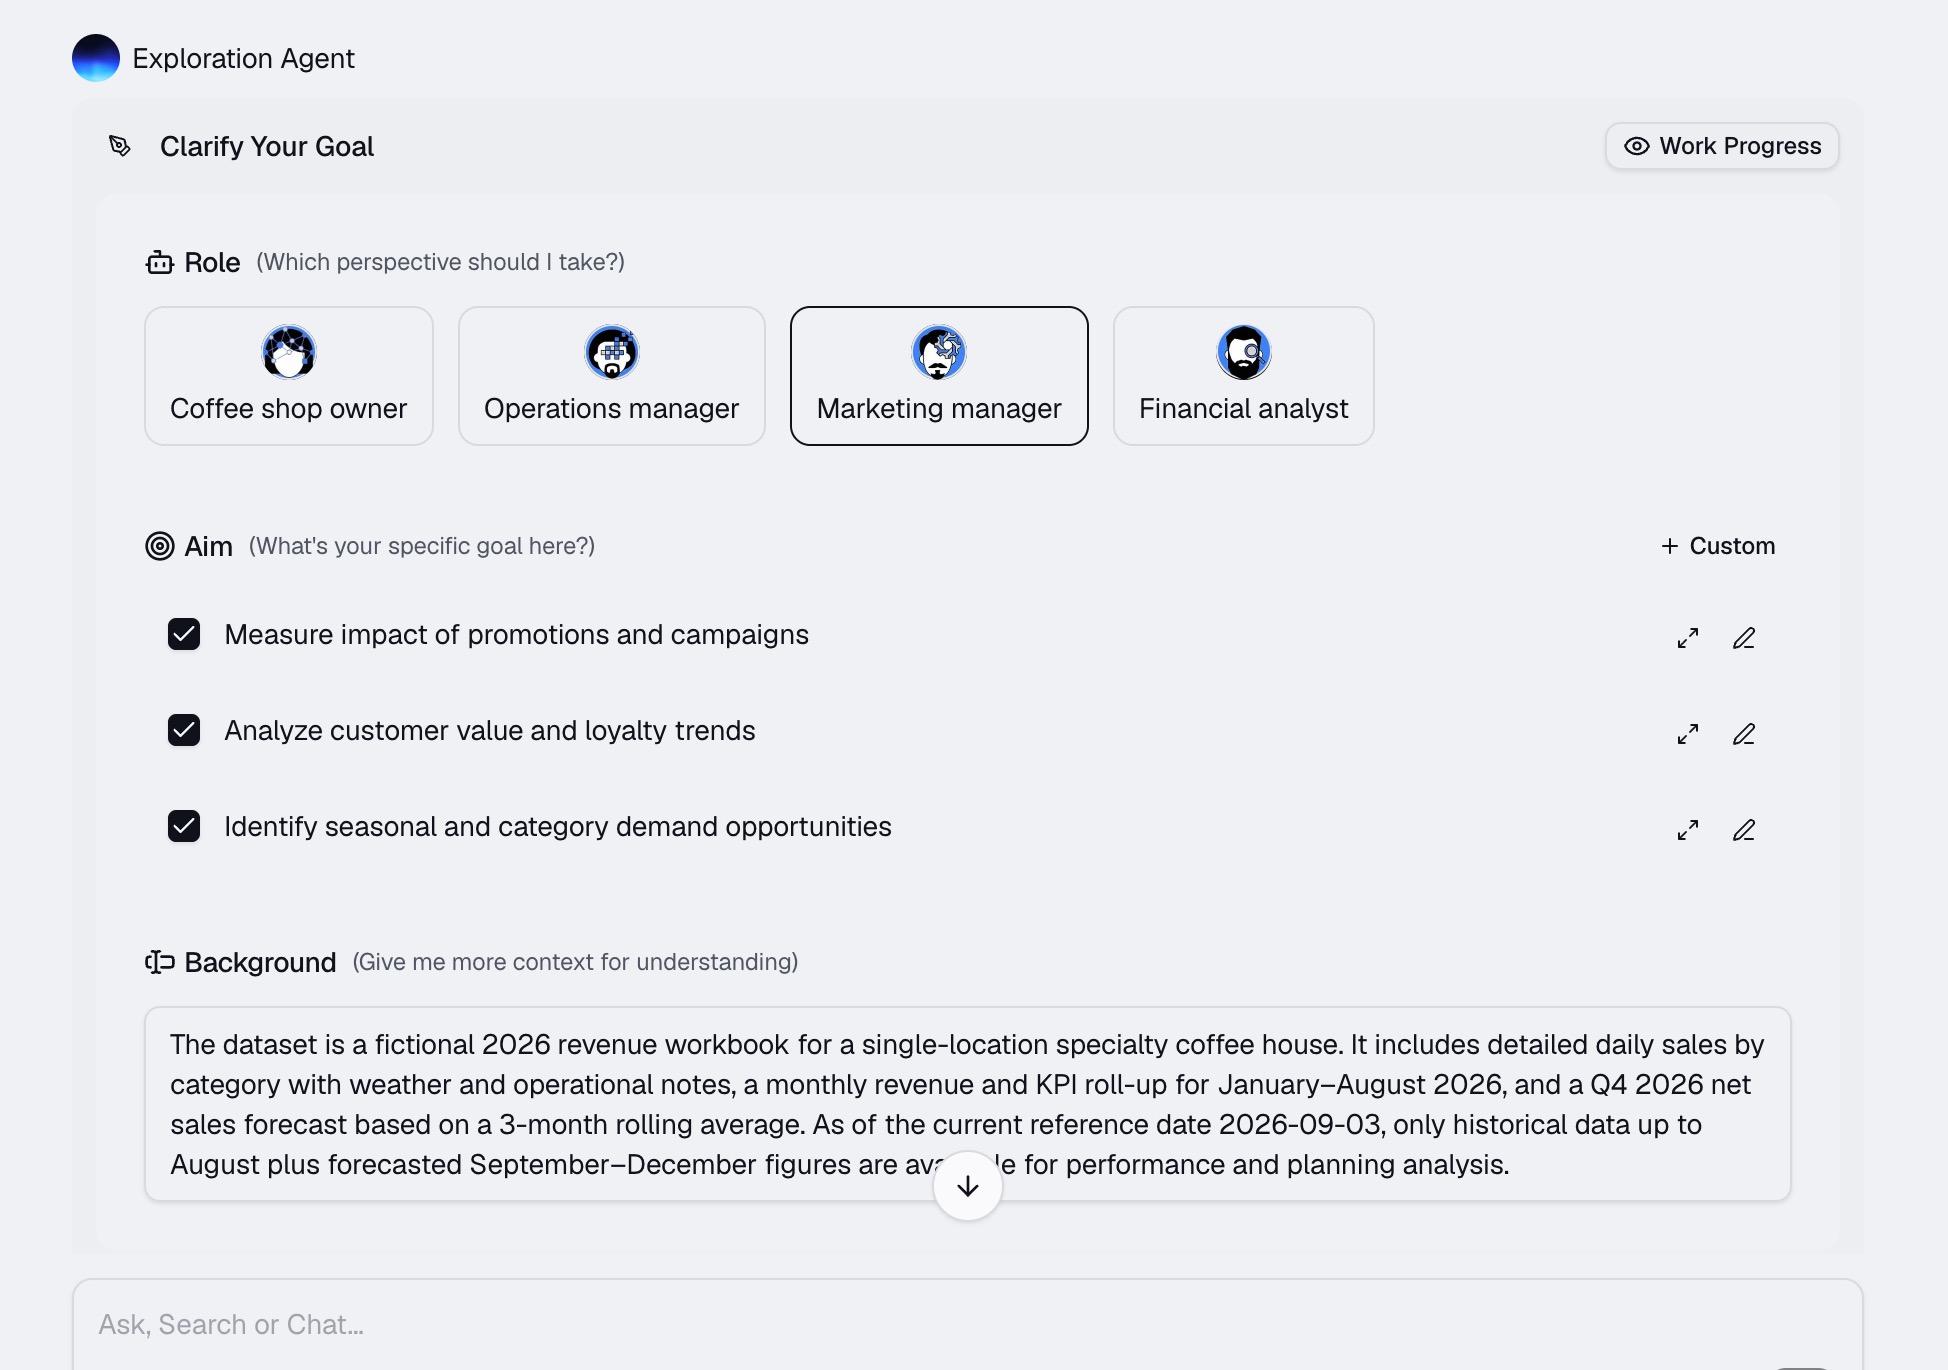
Selecting a role provides vital context, instructing the AI on exactly which perspective to take when reviewing your spreadsheet. Next, you define your specific aim by checking targeted objectives, such as analyzing "Monthly and seasonal sales patterns," ensuring your forecast perfectly aligns with your professional needs.
Step 3: Ask Bloom by Natural Language
This step highlights the true magic of Powerdrill Bloom. Instead of navigating drop-down menus to select algorithms like ARIMA or Exponential Smoothing, you simply talk to the AI just as you would talk to a human analyst.
Navigate to the chat interface and type your request using everyday natural language. For example, you can type: "Based on the historical sales data provided, please forecast our total revenue for the next quarter."
Because Powerdrill Bloom is powered by advanced Large Language Models, it understands the context, nuances, and specific constraints of your prompt. It translates your conversational request into complex backend data queries instantly.
Step 4: Generate a Next-Quarter Sales Forecast
Within seconds of submitting your natural language prompt, Powerdrill Bloom will generate a comprehensive next-quarter sales forecast. However, the platform provides much more than just a single, static number.
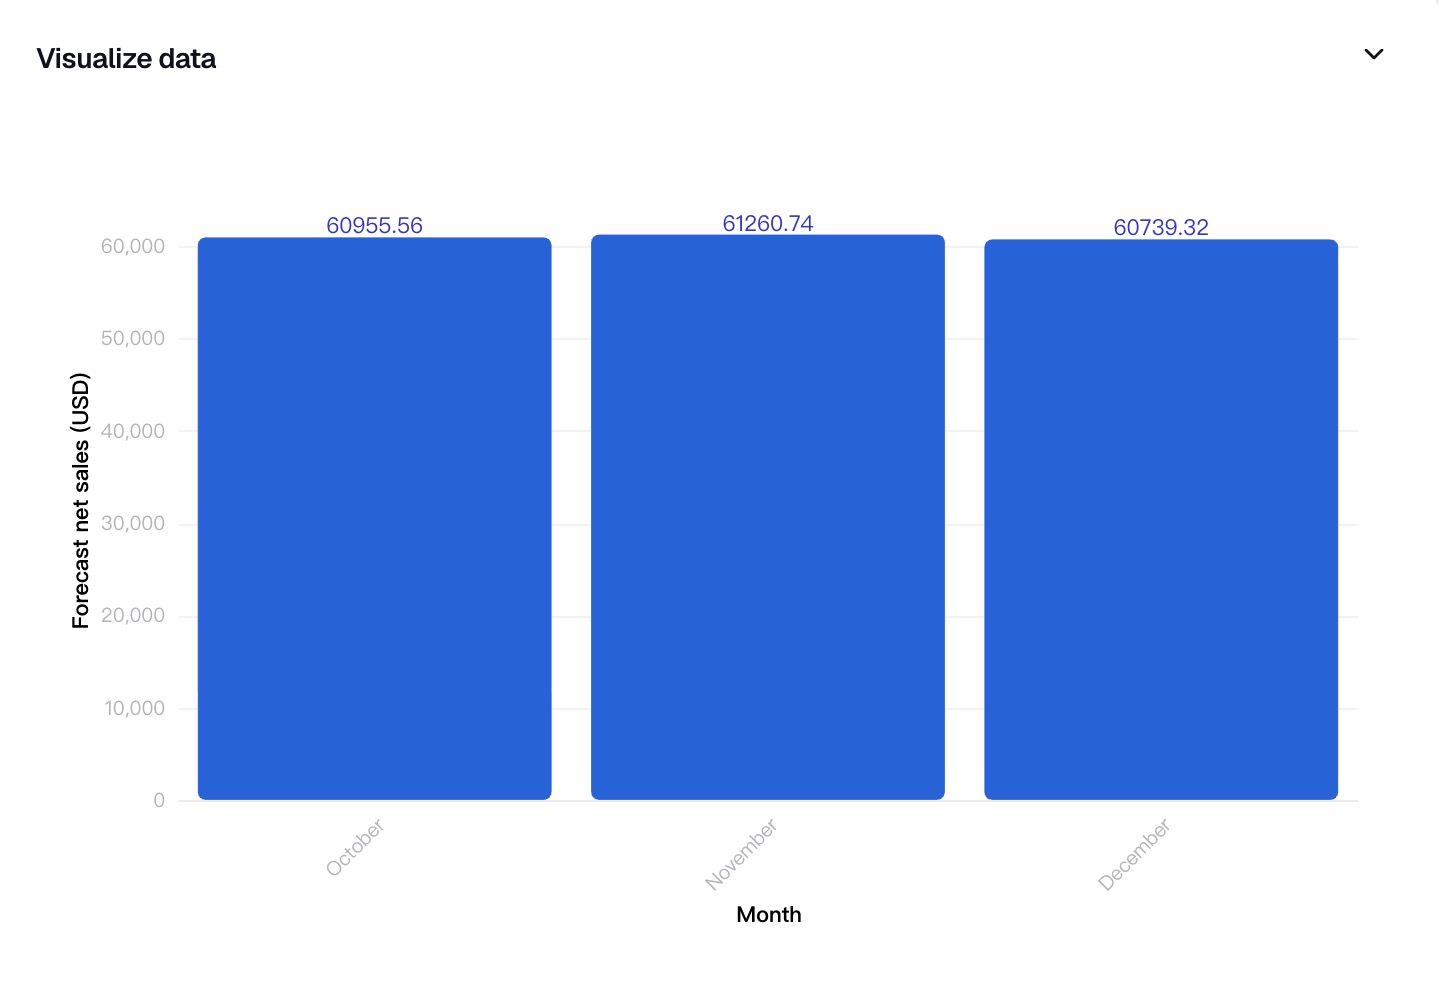
You will receive a detailed output that includes predictive revenue figures broken down by your requested timeframes (e.g., weekly or monthly). Furthermore, the AI automatically generates stunning, professional-grade data visualizations, such as line charts showing the historical trend seamlessly connecting to the forecasted trajectory. It also includes confidence intervals, highlighting the best-case and worst-case scenarios based on market volatility. Once the forecast is generated, you can easily download the charts to include in your PowerPoint presentations, or export the predicted data back into an Excel format to share with your executive team or investors.
Common Mistakes When Forecasting Sales From Excel Data
Even with the best data, human error can easily derail a forecast. When analyzing historical Excel data—especially if doing it manually—people frequently fall into several common traps. Avoid these mistakes to ensure your predictions remain reliable:
Ignoring Seasonality and Trends: Treating every month equally is a massive mistake. If you sell winter coats, your Q4 sales will naturally be higher than your Q2 sales. Failing to account for these recurring seasonal peaks and valleys will result in a severely distorted forecast.
Failing to Exclude Outliers: Sometimes, a massive, one-time anomaly occurs—such as an unusually large bulk order from a single client, or a temporary factory shutdown. If you do not isolate and adjust for these outliers, your forecast will falsely assume these rare events will happen again next quarter.
Relying on Too Little Data: Trying to predict a three-month trend using only two months of historical data is like trying to guess the ending of a movie after watching the first five minutes. A lack of sufficient historical data leads to highly inaccurate, volatile predictions.
Overlooking External Market Factors: Data only tells you what happened, not what is happening in the broader economy. Ignoring new competitors entering the market, shifts in consumer behavior, or changing economic conditions will render your purely data-driven forecast obsolete.
Using Overly Simplistic Formulas: Relying strictly on simple averages or basic straight-line forecasting (e.g., assuming a flat 5% growth every month) fails to capture the complex, compounding variables inherent in real-world business environments.
The Advantage by Using AI to Forecast Next Quarter's Sales
Shifting from manual Excel forecasting to AI-driven analysis is a game-changer for businesses of all sizes. The integration of artificial intelligence brings a multitude of benefits that traditional spreadsheet software simply cannot match:
Unprecedented Speed and Efficiency: What used to take a financial analyst hours or even days to clean, format, and calculate can now be accomplished by AI in a matter of seconds. This frees up your team to focus on strategy rather than crunching numbers.
Democratization of Data: You no longer need to hire expensive data scientists to understand your metrics. AI tools level the playing field, allowing marketing managers, HR directors, and small business owners to perform complex predictive analytics using simple English.
Superior Pattern Recognition: Human eyes can easily miss subtle, underlying correlations hidden deep within thousands of rows of data. AI algorithms are designed to detect micro-trends and multi-variable relationships, resulting in a significantly more accurate forecast.
Drastic Reduction in Human Error: Manual data manipulation is prone to mistakes—a missed cell selection, a broken formula, or a copy-paste error can ruin a forecast. AI automates the analytical heavy lifting, practically eliminating these manual calculation errors.
Dynamic Scenario Planning: Unlike a static Excel formula, AI allows you to instantly adjust parameters. You can ask the AI, "What if our marketing budget decreases by 10% next month?" and immediately receive an updated, dynamic forecast reflecting that specific scenario.
Conclusion
Forecasting next quarter’s sales no longer needs to be a daunting, time-consuming chore that leaves you buried in complex spreadsheet formulas. By ensuring you have clean historical data, avoiding common analytical mistakes, and understanding the incredible advantages of modern technology, you can predict your business's future with absolute confidence. Excel is an amazing tool for storing and organizing your historical data, but when it comes to extracting actionable, forward-looking insights, artificial intelligence is the key to success. Stop wrestling with outdated forecasting methods. Experience the future of effortless, accurate predictive analytics by uploading your sales data to Powerdrill Bloomtoday, and let natural language AI drive your next quarter's strategy!
FAQs
Can I forecast sales with only one month of data?
No, accurate forecasting usually requires at least two years of historical data to identify seasonal trends and patterns.
Is my data safe when uploaded to Powerdrill Bloom?
Yes, Powerdrill Bloom uses enterprise-grade encryption to ensure your historical sales data remains completely secure and strictly confidential.
Do I need to know complex Excel formulas?
Not at all. Powerdrill Bloom relies entirely on simple, natural language prompts instead of complicated, traditional Excel formulas.
Can I export the forecast results back to Excel?
Absolutely. You can easily download the generated forecasts, insights, and charts back into Excel or PDF format immediately.
What file formats does Powerdrill Bloom support?
Powerdrill Bloom supports standard spreadsheet formats, including XLSX and CSV, making it perfectly compatible with your existing data.