How to Create a Marketing Funnel Report From Raw Data Without SQL (Beginner's Guide)
Introduction
Modern marketers are sitting on a massive goldmine of raw data. Between Facebook Ads, Google Analytics, Shopify, and your CRM, the data is all there, but connecting the dots is another story. The biggest roadblock? Most marketers lack the technical SQL skills required to stitch these disparate datasets together into a clear, cohesive marketing funnel.
Relying on a busy data engineering team can take weeks, while struggling with complex VLOOKUPs and pivot tables in Excel often leads to crashing spreadsheets and static, outdated reports. Fortunately, the era of data democratization is here. Thanks to the rise of AI-native business intelligence (BI) tools, you no longer need to write a single line of code to analyze your performance.
In this beginner's guide, we will show you how to turn messy raw data into a beautiful, actionable marketing funnel report in minutes, and how Powerdrill Bloom makes this entire process completely effortless.
What is a Marketing Funnel Report (And Why Use Raw Data)
Before diving into the "how," let's clarify the "what" and the "why." A marketing funnel report visualizes the customer journey, tracking how users move from initial brand awareness down to final purchase and retention.
Standard Funnel Stages Typically Include:
- Awareness (Top of Funnel): Ad impressions, website visits, and social media reach.
- Consideration (Middle of Funnel): Clicks, email sign-ups, and resource downloads.
- Conversion (Bottom of Funnel): Lead generation, free trial sign-ups, and completed purchases.
- Retention: Repeat purchases and subscription renewals.
Why Should You Build This Using Raw Data Instead of Relying on Pre-built Platform Dashboards
- Ultimate Granularity: Raw data (like an unfiltered CSV export from your CRM) contains every single user action. Pre-built dashboards aggregate data, which can hide crucial details.
- Cross-Platform Customization: Raw data allows you to merge Facebook ad clicks with actual Shopify sales, giving you a true end-to-end view that no single platform can provide.
- Uncover Hidden Drop-offs: By analyzing raw event logs, you can pinpoint the exact micro-step where users abandon the journey (e.g., dropping off at the billing page vs. the shipping page).
The Old Way vs. The New Way (Why Skip SQL?)
For decades, creating a custom funnel report from raw data meant learning SQL (Structured Query Language). Today, AI-powered conversational analytics has completely flipped the script. Here is a quick look at why marketers are ditching the old way for the new way:
| Feature | The Old Way (SQL & Traditional BI) | The New Way (AI & Powerdrill Bloom) |
|---|---|---|
| Required Skills | Advanced SQL (JOINs, GROUP BYs), data modeling | Plain English / Conversational language |
| Setup Time | Weeks (requires data pipelines & data warehouses) | Minutes (Direct file upload) |
| Query Method | Writing lines of complex code syntax | Asking a question like chatting with a colleague |
| Flexibility | Rigid; changing the report requires rewriting code | Dynamic; type a new prompt to instantly change the chart |
| Error Rate | High; one missing comma breaks the entire query | Zero; the AI handles all underlying calculations automatically |
4 Steps to Build a Marketing Funnel Report Without SQL
Ready to build your report? Forget complex tutorials. With the right AI tool, analyzing marketing data without SQL is as easy as sending a text message.
Step 1: Upload Data to an AI-Native BI Tool (Enter Powerdrill Bloom)
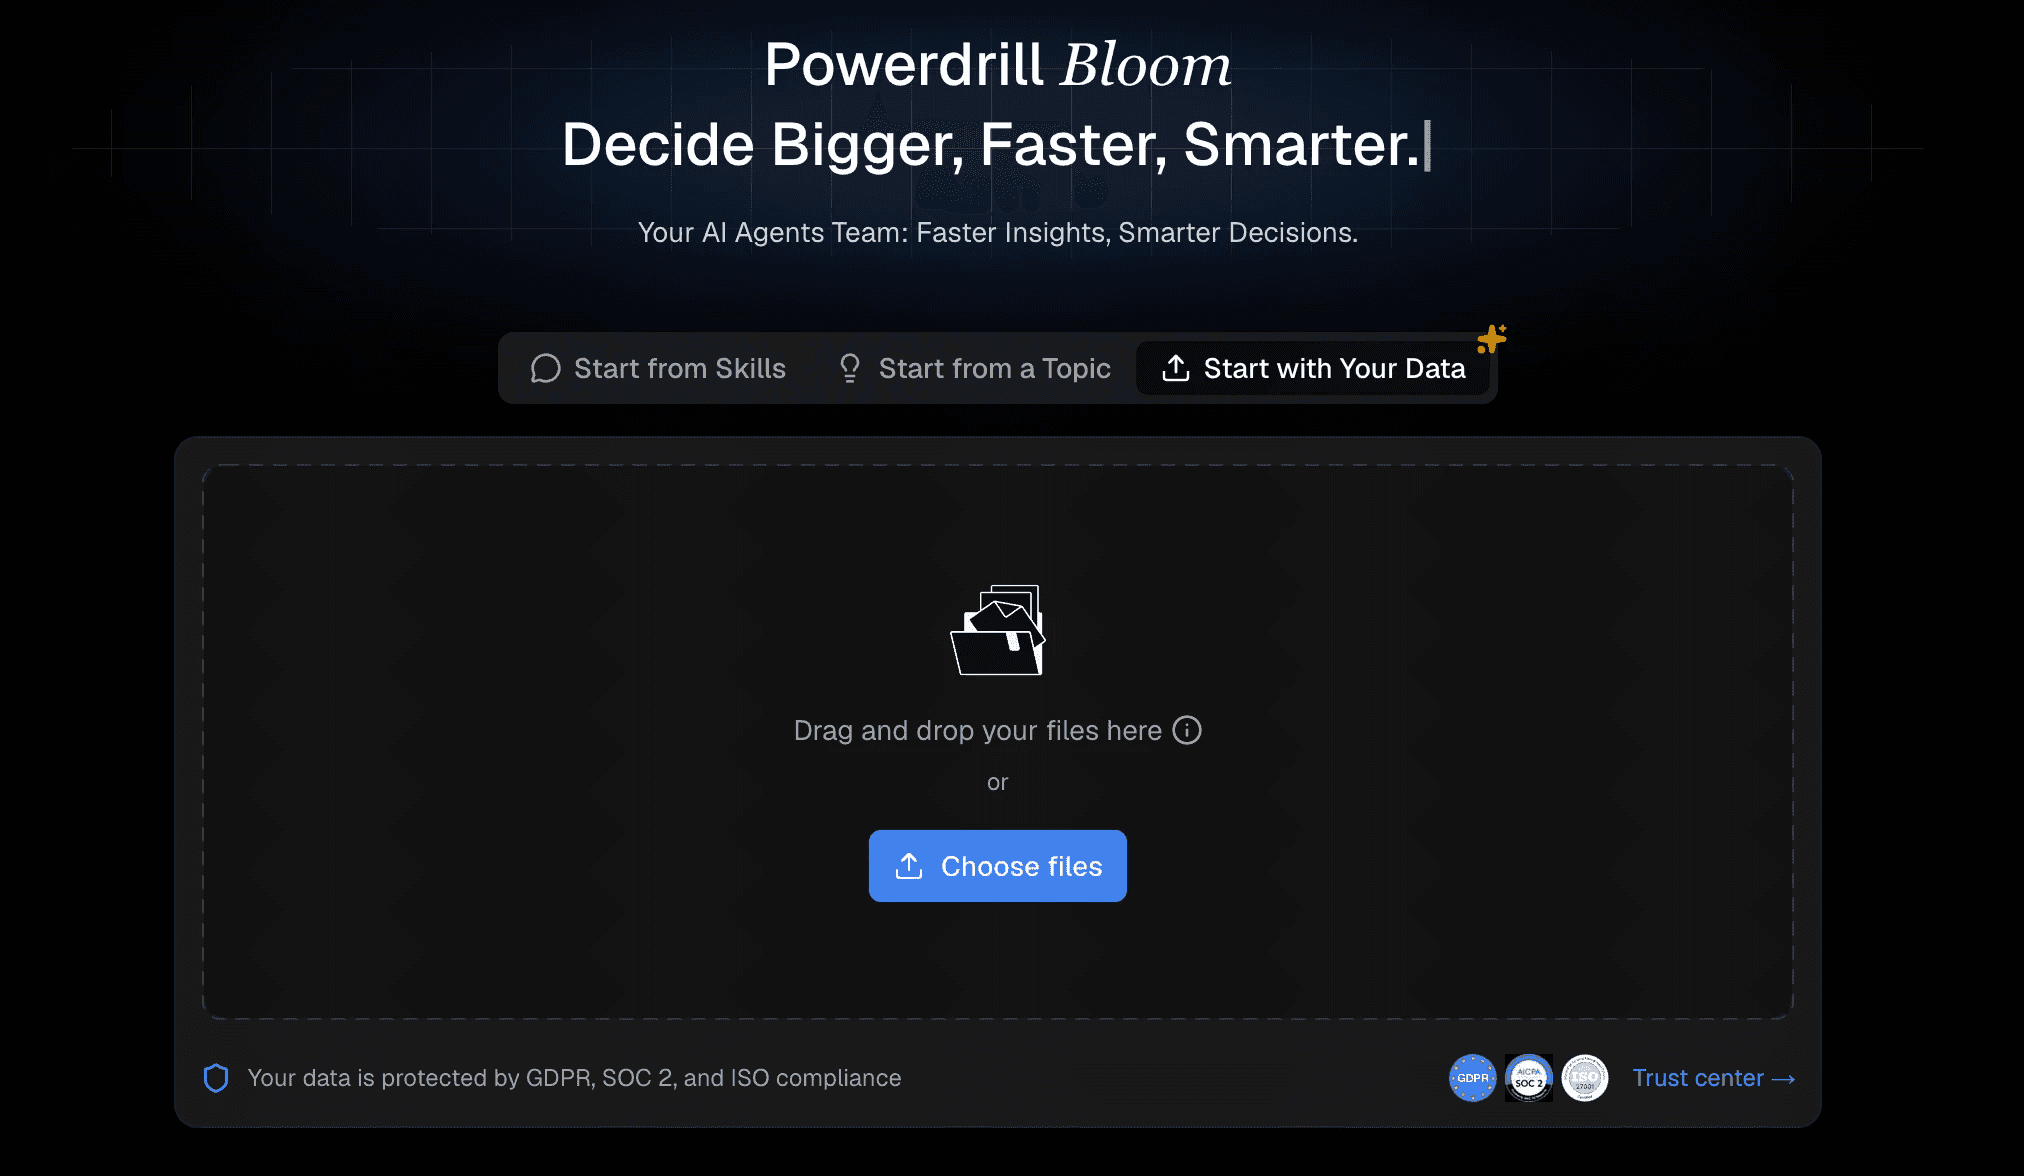
The hardest part of traditional data analysis is building pipelines to connect data sources. With Powerdrill Bloom, you get to skip the IT department entirely. Simply export your raw data from your marketing platforms (like a CSV or Excel file of your ad performance or CRM leads). Then, drag and drop these files directly into the Powerdrill Bloom interface. The platform's intelligent AI data mapping immediately reads your file, automatically understanding which columns represent dates, campaign costs, clicks, and conversions. No database setup is required.
Step 2: Clarify Your Goal to Explore the Data
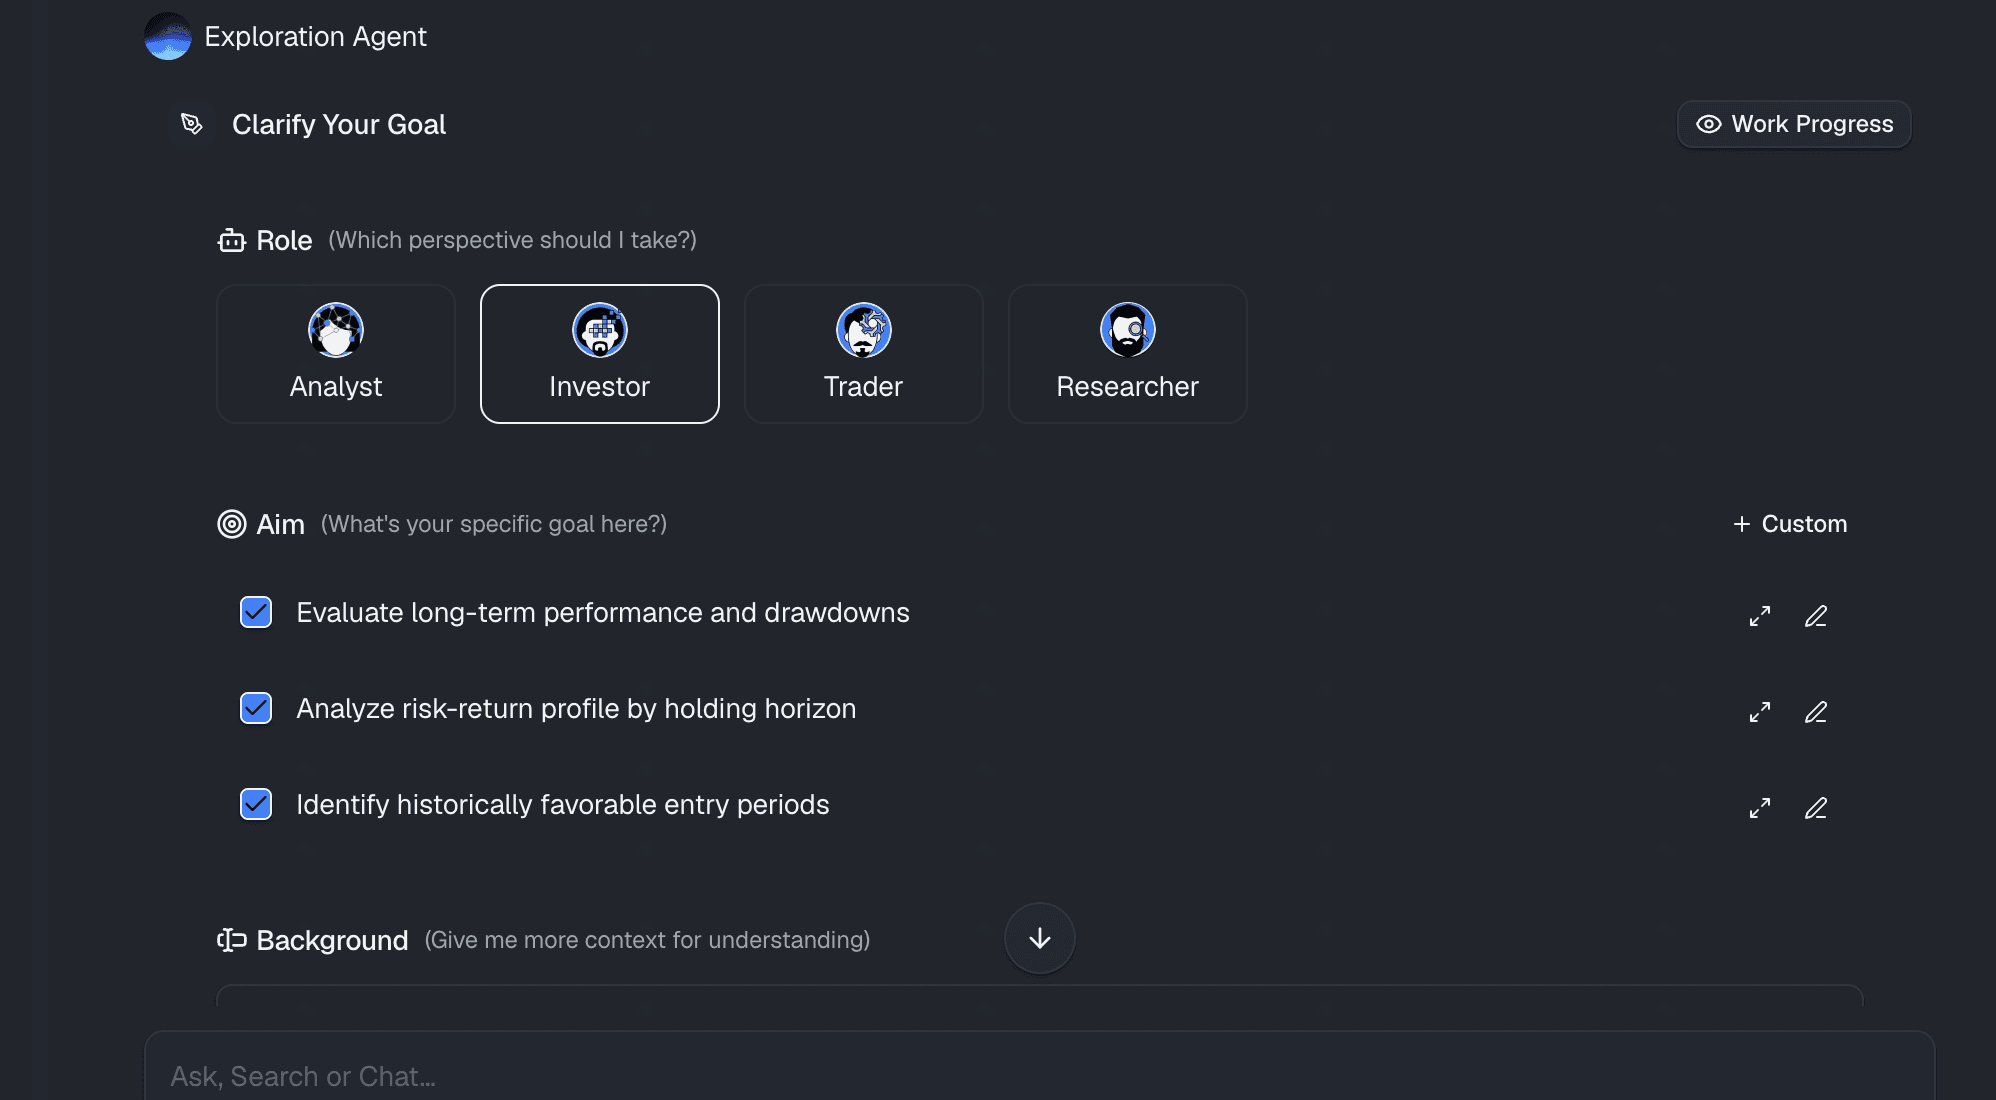
Before you start generating charts, you need a clear objective. What specific story are you trying to uncover from your raw data? Are you trying to find the conversion rate from landing page visitors to newsletter subscribers? Or are you looking for the drop-off rate between adding an item to the cart and completing checkout? Knowing your goal gives the AI proper context. The beauty of Powerdrill Bloom is that if you are unsure where to start, its AI assistant can scan your uploaded data and proactively suggest valuable marketing goals and metrics for you to explore.
Step 3: Define Your Funnel Stages Using Plain Language
This is where the magic happens. Instead of writing a complex SQL, you simply use the chat interface. You type your goal in plain language.
The AI immediately parses your intent, cross-references your raw data, and performs all the underlying calculations instantly. It completely removes the technical barrier between your curiosity and the data.
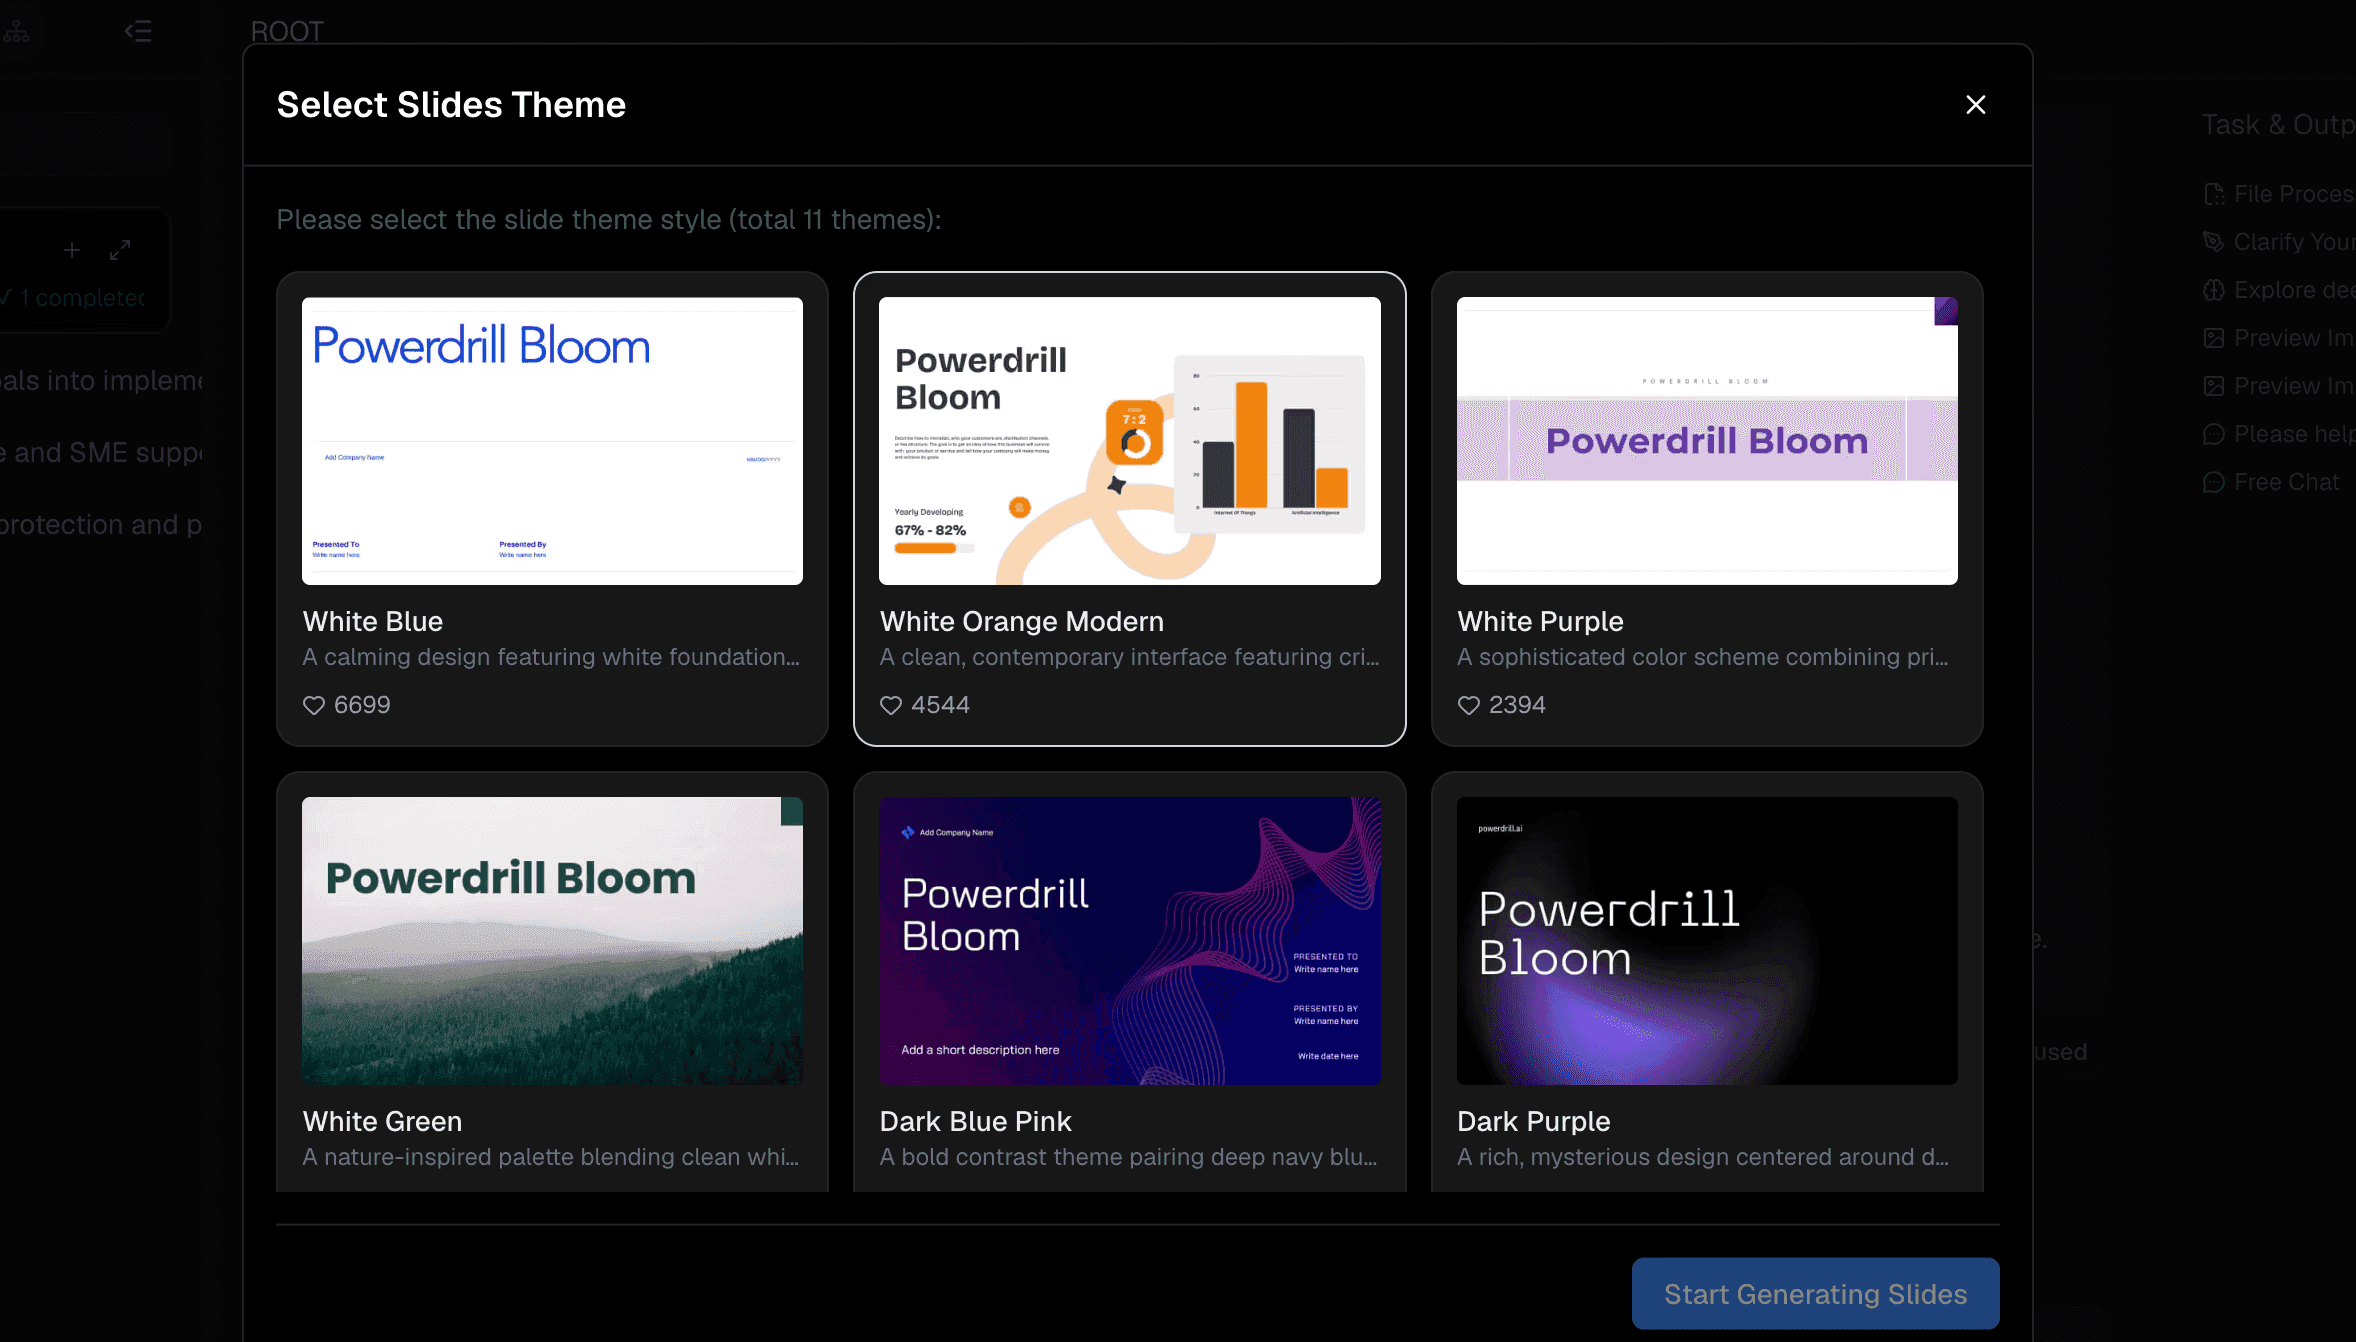
Step 4: Generate and Share the Visual Report
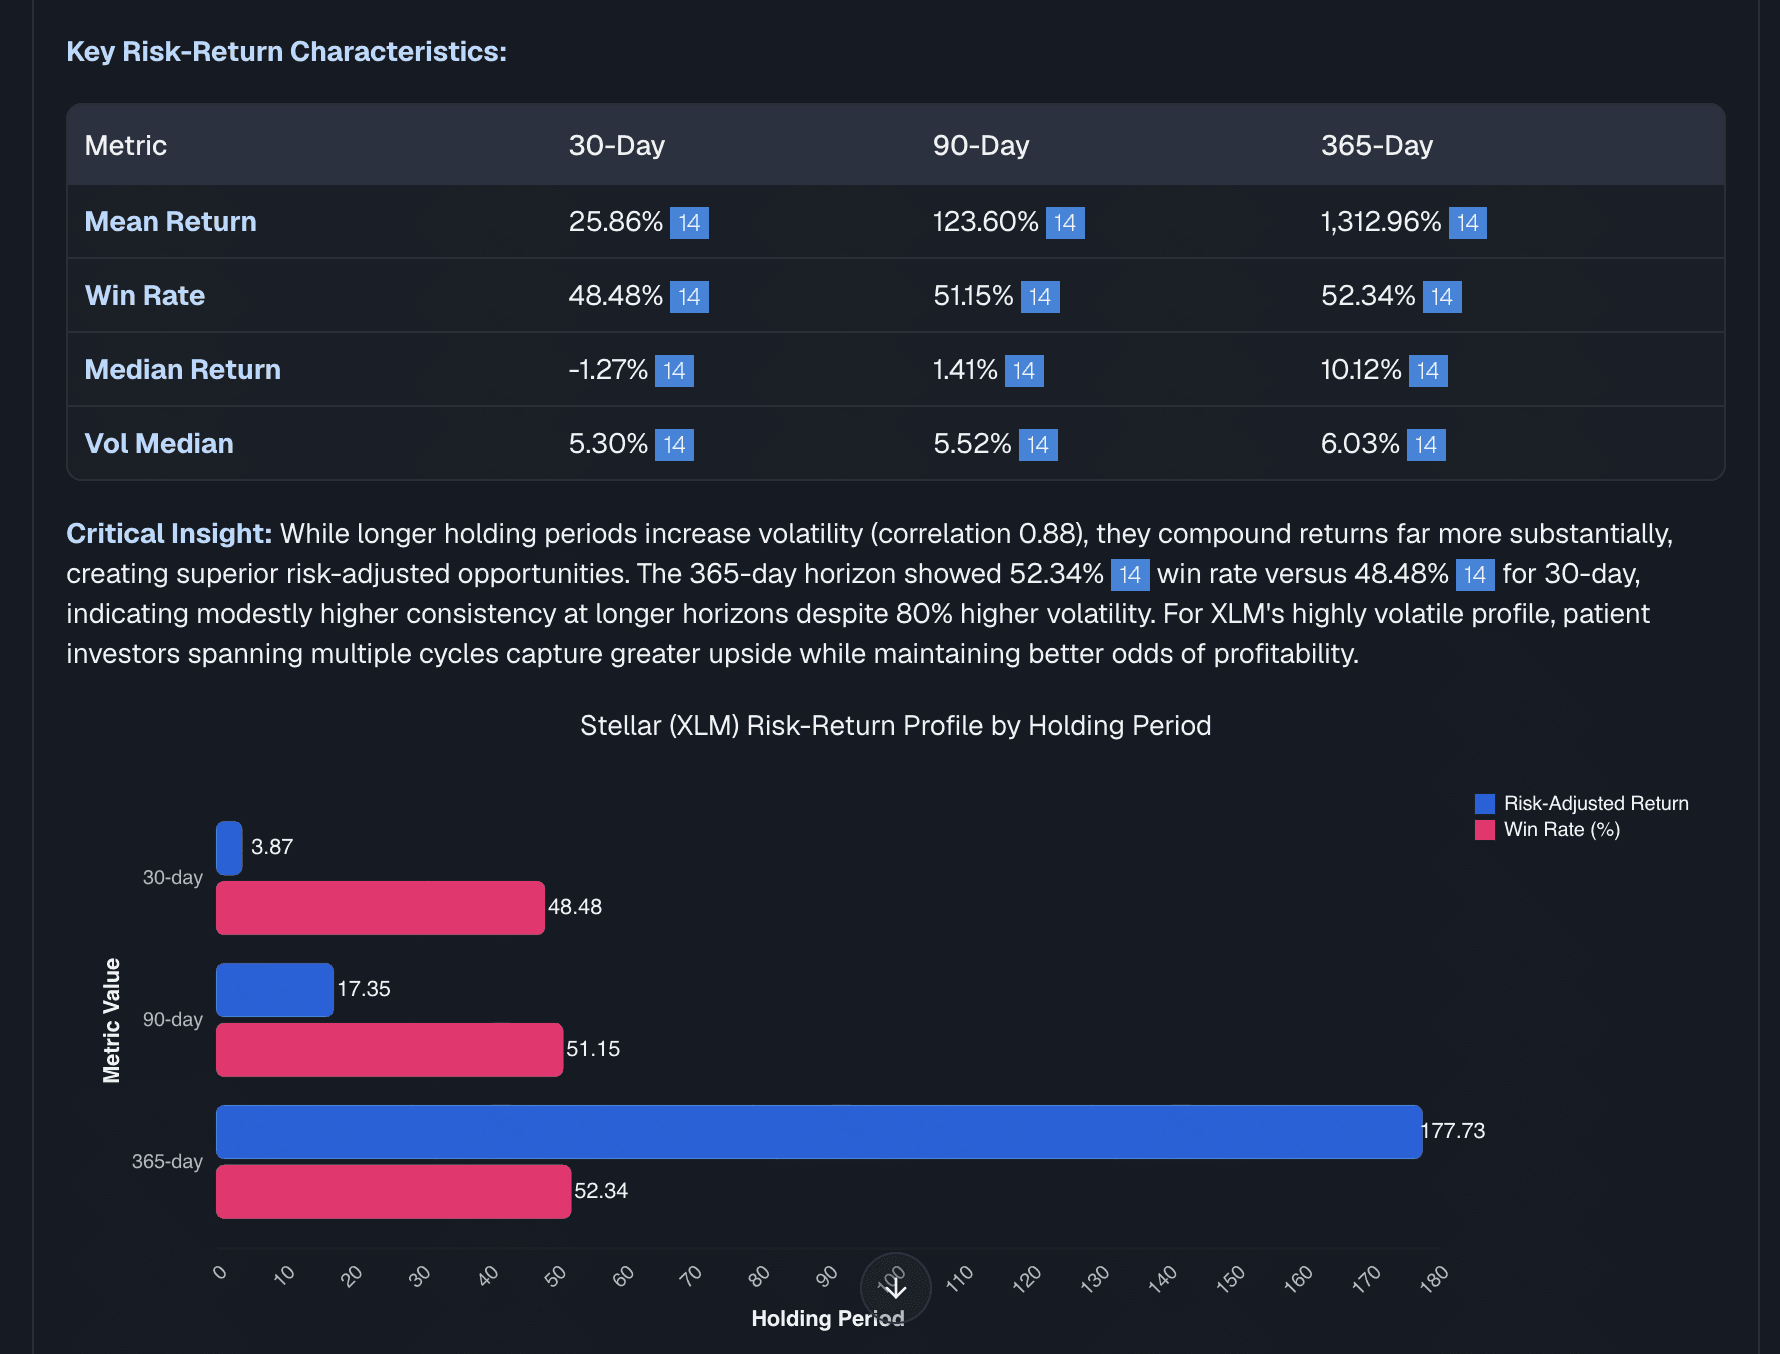
Within seconds of hitting enter, Powerdrill Bloom generates a highly accurate, presentation-ready funnel chart. You will visually see exactly where your marketing leaks are. But the process doesn't stop there. Once the AI generates the visual report, you can pin it to a live dashboard, export it as a high-quality image for your presentation, or share a secure, interactive link with your marketing team. You can even set up the AI to auto-refresh this data weekly, putting your reporting entirely on autopilot.
Why Powerdrill Bloom is the Best Tool for Marketers
If you want to stop fighting with spreadsheets and start optimizing your campaigns, Powerdrill Bloom is the ultimate solution. Here is why it stands out as the best no-code marketing analytics tool:
- Zero SQL Required: It features a truly conversational user interface built on advanced AI. You just ask questions, and it delivers answers.
- Instant Insights: It drastically reduces the time to value. You can go from a messy raw CSV file to a polished, actionable funnel dashboard in mere seconds.
- Automated Reporting: You only need to set up your funnel once. Let the AI summarize your marketing performance and send you insights daily or weekly.
- Highly Cost-Effective: It provides enterprise-level AI analytics and data science capabilities at a fraction of the cost of traditional BI tools, even offering a free tier for beginners to start experimenting immediately.
Conclusion
Creating a custom marketing funnel report from raw data is no longer an exclusive job reserved for data engineers and SQL experts. By leveraging AI-native BI tools, you can bypass the technical hurdles and focus directly on what matters: finding insights, fixing funnel drop-offs, and scaling your marketing campaigns.
Stop letting valuable raw data go to waste in static spreadsheets. Turn your data into growth intelligence today and try Powerdrill Bloom for free and experience the future of no-code marketing analytics.
FAQs
Can I build a marketing dashboard without knowing SQL?
Yes. Using AI-driven tools like Powerdrill Bloom, you can create comprehensive marketing dashboards simply by typing your questions in plain English, completely skipping SQL.
What is the best format for raw marketing data?
Standard CSV or Excel (.xlsx) formats are ideal. You can easily drag and drop these files directly into Powerdrill Bloom to start your data analysis instantly.
How do I track funnel drop-off rates automatically?
Upload your raw traffic and conversion data into Powerdrill Bloom, and ask the AI to "calculate the drop-off rate between stages." It will generate the precise funnel chart for you.
Are AI data analysis tools safe for my company data?
Absolutely. Top-tier platforms like Powerdrill Bloom employ enterprise-grade security and strict data privacy protocols to ensure your raw marketing data remains safe and confidential.