How to Build a Marketing Attribution Report for Your Weekly Standup (Free Tutorial)

For modern marketing teams, the weekly standup meeting is a critical ritual. It is the moment when teams gather to discuss project data, align on current goals, and identify roadblocks. However, preparing for these meetings can often be a nightmare. Marketers find themselves spending hours before the standup frantically pulling data from various platforms, downloading spreadsheets, and trying to stitch together a coherent narrative. Instead of focusing on strategy, teams are bogged down by administrative data gathering.
When we talk about marketing "project data," the most critical metric teams need to discuss during a weekly standup is marketing attribution. Knowing where your leads and sales came from over the past week dictates how you will spend your time and budget in the upcoming week. A weekly standup report in a marketing context is, essentially, a condensed, actionable marketing attribution report.
Fortunately, the days of spending hours building complex pivot tables in Excel are over. With the rise of advanced AI data analysis tools, generating a comprehensive, accurate weekly standup report based on your raw project data is easier than ever.
In this comprehensive guide, we will explore what a marketing attribution report is, why building them manually is a recipe for burnout, and how you can use a powerful tool like Powerdrill Bloom to automate the entire process. By the end of this tutorial, you will know exactly how to turn raw project data into actionable insights, ensuring your next weekly standup is driven by facts, not guesswork.
What Is a Marketing Attribution Report
A marketing attribution report is an analytical summary that identifies which marketing channels, campaigns, or touchpoints contributed to a specific conversion, sale, or lead. Because modern consumers rarely buy a product after seeing just one advertisement, attribution reports help marketers untangle the complex web of interactions that lead to a final purchase.
To fully grasp the value of this report for your weekly standups, here is a detailed breakdown of what a marketing attribution report actually does:
Maps the Complete Customer Journey: Unlike basic analytics that only show you where a customer made their final click, an attribution report maps out the entire journey. It tracks how a user might have discovered you through an Instagram ad, researched you via a Google search a few days later, and finally converted through an email newsletter.
Assigns Value and ROI to Specific Channels: By understanding the customer journey, the report helps you assign financial value to different marketing channels. If a blog post assisted in generating $10,000 worth of sales, the attribution report highlights this, allowing you to calculate an accurate Return on Investment (ROI) for your content marketing efforts.
Utilizes Various Attribution Models: A robust attribution report allows you to view data through different lenses (or models). This includes First-Click attribution (valuing the initial discovery), Last-Click attribution (valuing the final touchpoint), Linear attribution (giving equal credit to all touchpoints), and Time-Decay attribution (giving more credit to interactions closest to the sale).
Highlights High-Performing and Underperforming Assets: It breaks down your project data granularly, showing you exactly which ad creatives, keywords, or landing pages are doing the heavy lifting, and which ones are draining your budget without yielding results.
Guides Future Budget Allocation: The ultimate purpose of a marketing attribution report is to inform future actions. By showing you the factual data of what is driving revenue, it gives you the confidence to scale up budgets on winning campaigns and pause failing ones before your next weekly standup.
Why Marketing Attribution Reports Are Hard to Build Manually
If attribution reports are so vital, why do so many marketing teams show up to their weekly standups without them? The simple answer is that building these reports manually is incredibly difficult, time-consuming, and frustrating.
Here are the primary reasons why manual marketing attribution reporting is an uphill battle:
Siloed and Fragmented Data Sources: Today’s marketing teams execute projects across a multitude of platforms—Google Ads, Meta Ads, TikTok, LinkedIn, HubSpot, Shopify, and more. Each of these platforms acts as a walled garden with its own tracking metrics and native reporting. Manually downloading CSV files from a dozen different sources and trying to merge them into a single master sheet is an organizational nightmare.
Platform Tracking Discrepancies: Every platform wants to take credit for a sale. If a customer clicks a Facebook ad on Monday and a Google ad on Tuesday before buying, both Facebook and Google will claim 100% of the revenue in their native reports. If you manually add up the revenue reported by each platform, it will falsely appear that you made twice as much money. Untangling this duplication manually requires complex deduplication logic that most marketers do not have the time to build.
The Complexity of Cross-Device Tracking: Customers frequently switch between devices. They might see an ad on their mobile phone while commuting, but make the actual purchase on their desktop computer at home. Manually trying to connect these disparate user sessions in a spreadsheet without the help of algorithmic mapping is virtually impossible.
High Risk of Human Error: When you are manually copying and pasting data, dragging formulas across thousands of cells, and dealing with massive datasets, human error is inevitable. A single broken VLOOKUP formula or a misplaced decimal point can skew your entire weekly standup report, leading to disastrous budget decisions.
Time Consumption vs. Actionability: Marketing data moves fast. By the time a data analyst or marketing manager spends three days manually compiling last week's attribution report, the data is already stale. Teams need immediate insights for their weekly standups, and manual reporting simply cannot keep up with the agile pace required for modern marketing projects.
How to Build a Marketing Attribution Report With Powerdrill Bloom
To eliminate the headaches of manual data wrangling, you can leverage AI-powered data analytics. Powerdrill Bloom is an innovative, AI-driven data analysis platform designed to act as your personal data scientist. It allows you to transform raw, messy project data into beautiful, actionable marketing attribution reports in minutes, entirely without coding.
Here is a free, step-by-step tutorial on how to generate your weekly standup report using Powerdrill Bloom.
Step 1: Upload your Data
The first step in generating your report is getting your project data into the system. Powerdrill Bloom is designed for seamless data integration, completely eliminating the need for complex database management. Simply export your raw campaign data, CRM data, or sales logs from your various platforms (like Google Analytics, Facebook Ads, or HubSpot).

You can upload these files directly into Powerdrill Bloom in standard formats like CSV, Excel, or JSON. Because Powerdrill Bloom handles the heavy lifting, you don't need to worry about perfectly formatting your columns or pre-cleaning your data. The platform’s robust parsing capabilities will ingest your datasets securely, preparing them for immediate AI analysis.
Step 2: Ask AI to Analyze Your Marketing Data
This is where the magic happens. Instead of writing complex SQL queries or fighting with pivot tables, Powerdrill Bloom allows you to interact with your data using natural language. It features an intuitive, conversational AI interface.
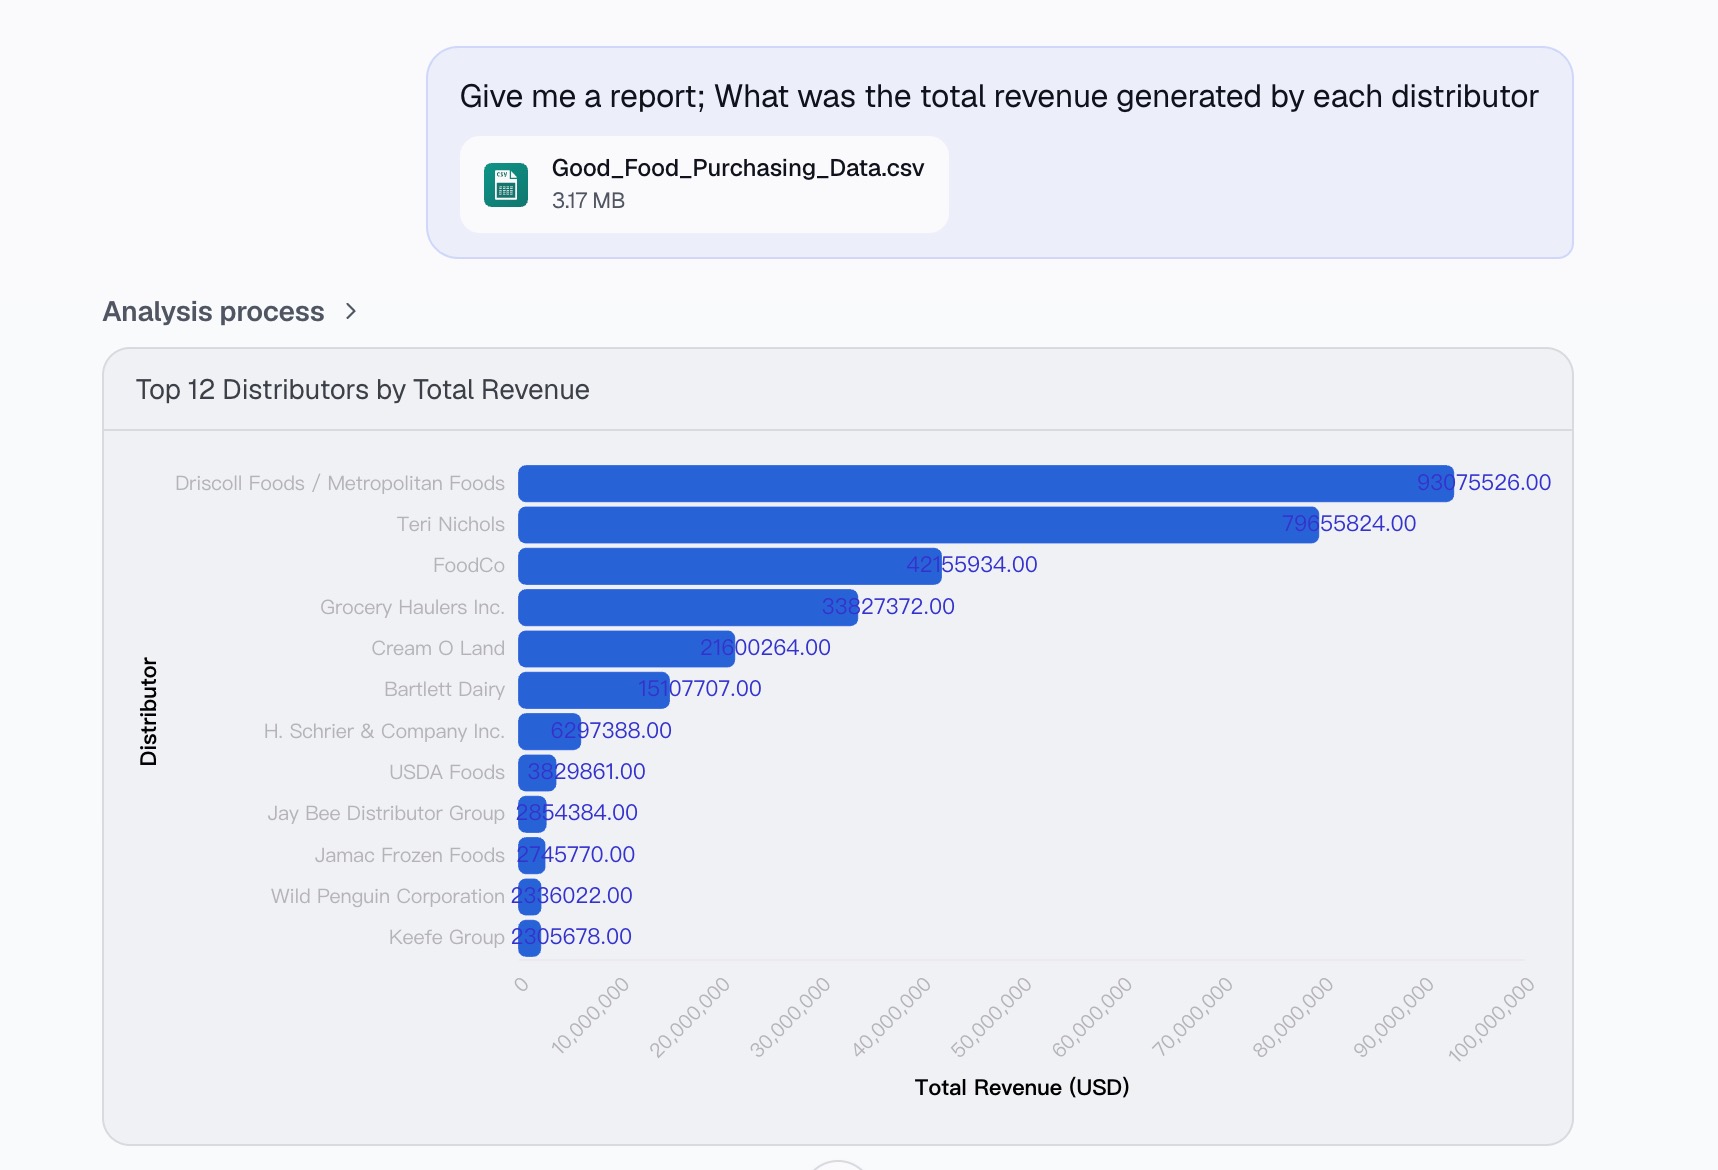
To build your marketing attribution report for the weekly standup, you simply ask the AI questions exactly as you would ask a human data analyst. For example, you can type prompts such as:
"What was the total revenue generated by each marketing channel last week?"
"Show me the conversion path for users who purchased our premium subscription."
"Compare the Customer Acquisition Cost (CAC) between Google Ads and Meta Ads for the last 7 days."
"Which campaign had the highest first-touch attribution value?"
Powerdrill Bloom’s AI engine instantly processes your request, correlates the data across your uploaded files, and generates accurate mathematical answers accompanied by visual charts. It automatically identifies trends, handles deduplication, and applies logical attribution modeling based on your prompts.
Step 3: Generate and Export Your Report
Once you have asked the AI your core questions and generated the necessary insights, it is time to assemble your weekly standup report. Powerdrill Bloom allows you to pin your favorite charts, graphs, and AI-generated summaries into a cohesive, interactive dashboard.
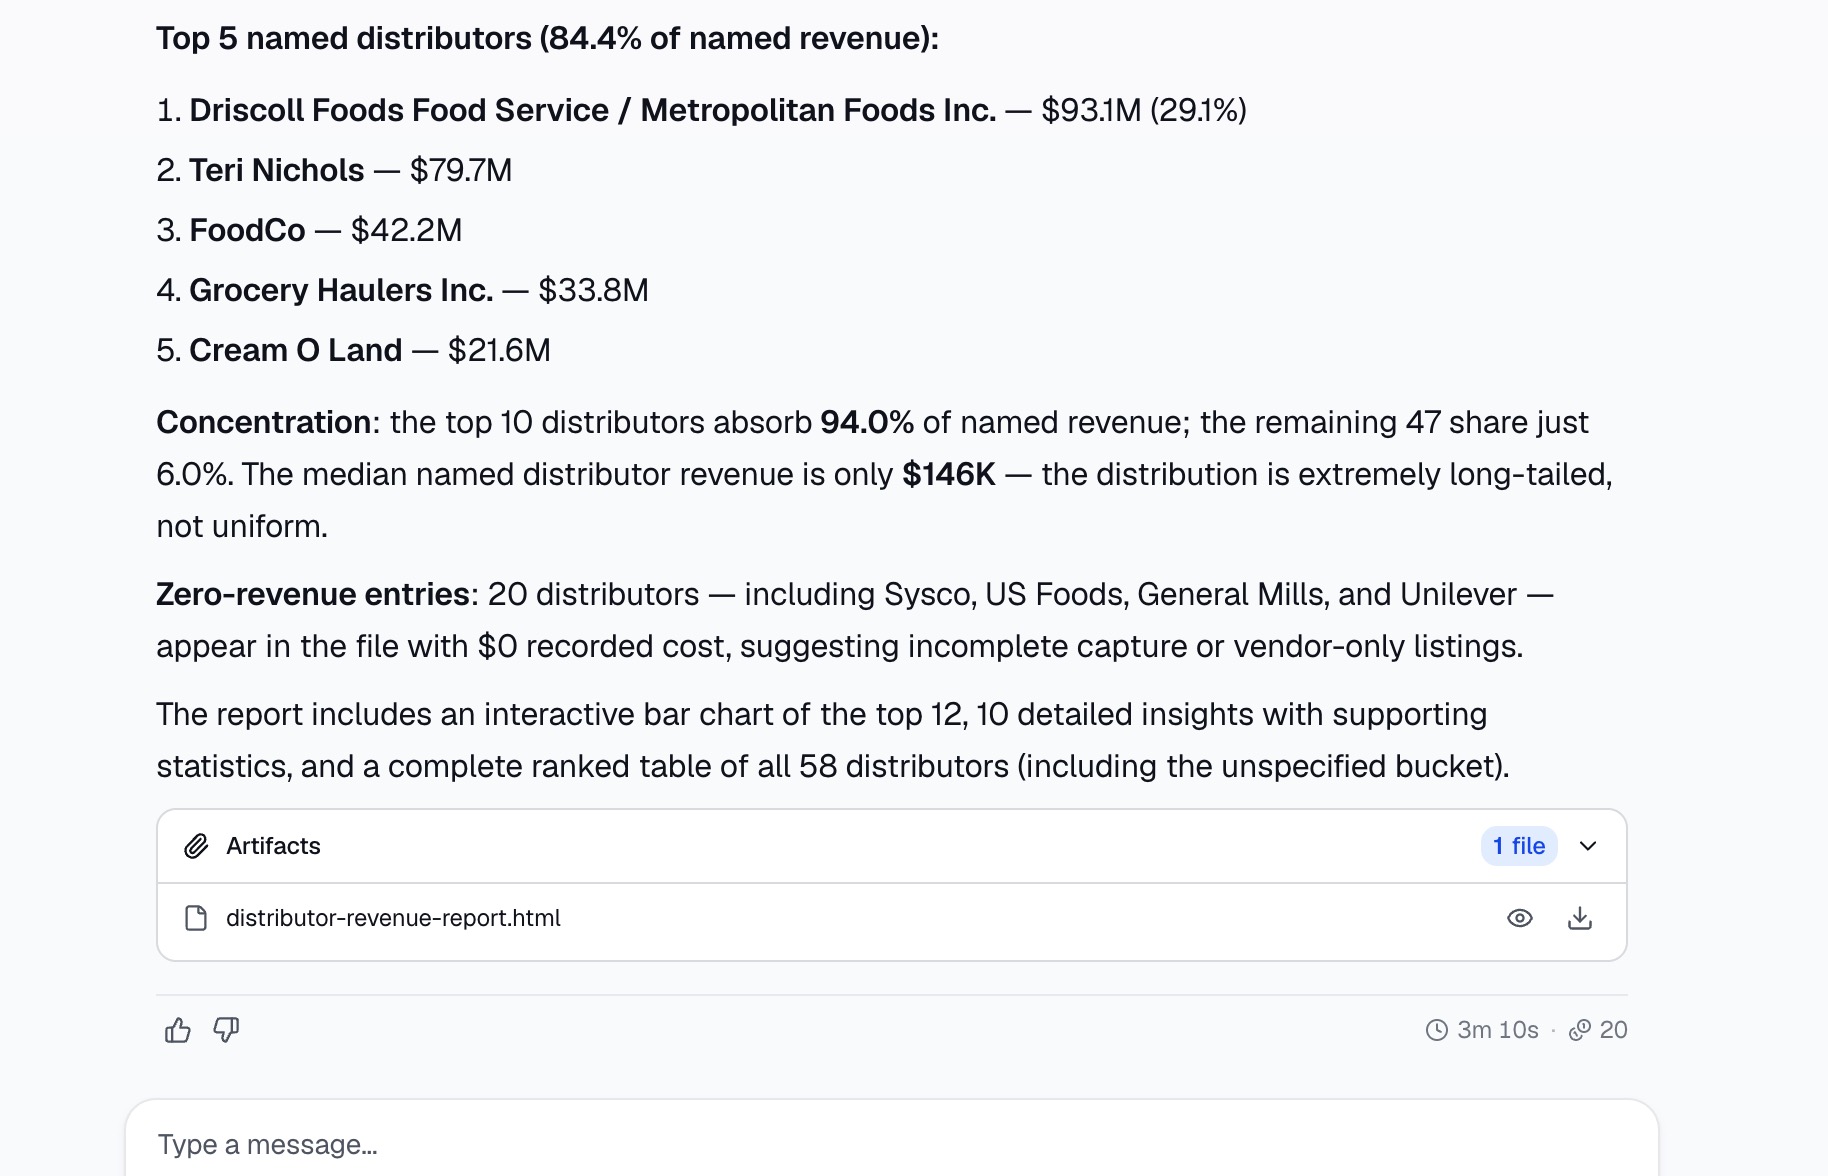
You can customize the layout to tell a logical story about your week’s marketing project data. When the dashboard is ready, you can export it with a single click. Whether you need to download a high-quality PDF to present in a boardroom, export the visuals to Google Slides, or share a direct link to the live dashboard in your team’s Slack channel before the standup, Powerdrill Bloom makes distribution effortless. You now have a comprehensive, enterprise-grade report generated in minutes.
How to Analyze Your Marketing Attribution Report
Generating the report is only half the battle; the real value comes from how you interpret the data during your weekly standup. To make your meetings highly productive, you must know exactly what to look for.
Here is how you should analyze your marketing attribution report:
Evaluate Channel-Specific ROI and ROAS: Look beyond vanity metrics like clicks and impressions. Focus strictly on Return on Investment (ROI) and Return on Ad Spend (ROAS). Identify which channels are actually driving pipeline and revenue. If a specific ad group has high traffic but zero attribution to closed won deals, it is a prime candidate for budget cuts.
Analyze the Time-to-Conversion (Lag Time): Use your attribution report to see how long it takes a user to convert after their first interaction. If your data shows a 14-day conversion lag, you will know not to panic if a new campaign launched on Monday hasn't generated sales by Friday's standup. This helps manage team expectations.
Assess the Interplay Between Channels (Assisted Conversions): Look for the "unsung heroes" of your marketing mix. For instance, your blog content might rarely get the "Last Click" before a sale, but your attribution report might show it is present in 60% of all successful customer journeys as an assisting touchpoint. Recognizing this prevents you from accidentally cutting budgets for crucial top-of-funnel projects.
Identify Trends and Anomalies: Compare this week's attribution data against the previous week's baseline. Are leads from LinkedIn suddenly twice as expensive? Did organic search traffic spike on Wednesday? Spotting these anomalies early allows your team to investigate root causes immediately after the standup.
Map Data to Team KPIs: Finally, tie the attribution data directly to the individual performance goals of your team members. Show the content team how their new whitepaper contributed to lead generation, and show the performance marketing team how their bid adjustments lowered the overall Customer Acquisition Cost (CAC).
Common Marketing Attribution Mistakes to Avoid
Even with the best tools and data, marketers can fall into traps when interpreting their project data. Discussing these pitfalls during your standups will ensure your team remains objective and accurate.
Here are the most common marketing attribution mistakes you need to avoid:
Relying Solely on Last-Click Attribution: The biggest mistake teams make is giving 100% of the credit to the very last thing a customer clicked before buying (usually a branded search term or a retargeting ad). This creates a massive blind spot, completely ignoring the podcasts, blog posts, and awareness ads that originally introduced the customer to your brand.
Failing to Standardize UTM Parameters: Your attribution report is only as good as your tracking tags. If your team uses inconsistent UTM parameters (e.g., one person uses source=facebook, another uses source=FB, and another uses source=Facebook_Ads), your data will fragment, and the AI will struggle to group campaigns accurately. Strict UTM naming conventions are mandatory.
Ignoring "Dark Social" and Offline Channels: Word of mouth, Slack communities, Discord channels, and direct messaging (Dark Social) strip out tracking tags. If you look purely at digital attribution software, you will miss these massive drivers of revenue. Always include a "How did you hear about us?" survey in your checkout process to supplement your digital data.
Setting and Forgetting the Model: Your business evolves, and so should your attribution model. A startup heavily focused on brand awareness might benefit from First-Click attribution, while a mature company with complex sales cycles needs Multi-Touch attribution. Review your chosen model quarterly to ensure it still aligns with your project goals.
Falling for Confirmation Bias: It is easy to look at an attribution report and cherry-pick data that proves your current strategy is working. If you spent a month building a campaign and the attribution report shows it failed, do not torture the data until it looks positive. Accept the objective truth of the report and pivot your strategy accordingly.
Conclusion
Preparing for a weekly marketing standup shouldn't require sacrificing your time, energy, and sanity to manual spreadsheet management. By understanding what a marketing attribution report is and recognizing the severe limitations of building them manually, you can embrace smarter, more efficient workflows. Your project data holds the keys to scaling your business, but only if you can extract its insights quickly and accurately.
The future of marketing reporting is automated, intuitive, and AI-driven. If you are tired of dreading your weekly reporting duties, it is time to upgrade your workflow. Head over to Powerdrill Bloom today to turn your messy, complex project data into clear, compelling, and actionable weekly standup reports in just a matter of minutes. Let AI handle the data crunching, so you can focus on what you do best: strategizing, executing, and growing your brand.
FAQs
1. What is a weekly standup report?
A weekly standup report is a concise summary of project progress, KPIs, and marketing metrics discussed during regular team alignment meetings.
2. Is Powerdrill Bloom free to use?
Yes, Powerdrill Bloom offers accessible tiers allowing users to upload datasets and generate powerful AI-driven insights without upfront financial commitments.
3. What data formats does Powerdrill Bloom accept?
You can seamlessly upload various standard data formats into the platform, including CSV, Excel spreadsheets, and structured JSON files.
4. Can I use multi-touch attribution?
Absolutely. Advanced AI tools like Powerdrill Bloom easily analyze complex, multi-touch customer journeys across all your diverse marketing channels.
5. How often should I generate these reports?
For agile marketing teams, generating these attribution reports weekly is highly recommended to keep your standup meetings relevant and actionable.