How to Build a Headcount and Hiring Dashboard From HR Data (Start to Finish)
In today’s rapidly evolving corporate landscape, Human Resources has fundamentally shifted from a purely administrative function to a critical strategic partner. At the heart of this transformation is data. Whether you are scaling a startup, managing a global enterprise, or navigating a complex corporate restructuring, understanding your workforce dynamics is no longer optional—it is essential for survival and growth. However, despite the undisputed value of HR analytics, many organizations still struggle to turn their raw employee data into actionable insights.
Building comprehensive, accurate, and visually appealing reports often takes weeks of manual effort, leading to outdated insights by the time they reach the executive board. Enter the era of AI-driven analytics. Today, we are going to explore how you can bridge the gap between raw data and strategic decision-making using a revolutionary tool. In this comprehensive guide, we will walk you through exactly how to build a dynamic headcount and hiring dashboard from HR data using Powerdrill Bloom, from start to finish.
What Is a Headcount and Hiring Dashboard?
A headcount and hiring dashboard is a visual analytics tool that consolidates, tracks, and displays key human resources metrics related to an organization's workforce and recruitment efforts. Instead of digging through endless spreadsheets, HR professionals and executives can use a dashboard to get an immediate, big-picture view of the company’s human capital.
A highly effective headcount and hiring dashboard typically includes the following critical components:
Total Headcount and Demographics: A real-time snapshot of how many employees currently work at the company, broken down by department, location, employment type (full-time, part-time, contractor), and diversity metrics.
Turnover and Retention Rates: Visualizations that track how many employees are leaving the company voluntarily or involuntarily, helping to identify problematic departments or management issues.
Time-to-Fill and Time-to-Hire: Key recruitment metrics that measure the efficiency of your talent acquisition pipeline. It tracks the number of days it takes to move a candidate from application to an accepted offer.
Cost per Hire: An aggregate view of recruitment expenses (advertising, agency fees, recruiter salaries) divided by the number of hires, ensuring the HR budget is being utilized efficiently.
Offer Acceptance Rate: The percentage of extended job offers that are accepted by candidates, providing a direct reflection of your company's employer brand and compensation competitiveness.
Headcount Forecasting: Predictive analytics that compare current staffing levels against future hiring plans, ensuring that the company has the right talent pipeline to meet its strategic goals.
Why Headcount and Hiring Reporting Still Hurts
Despite living in a golden age of technology, HR reporting remains a massive pain point for thousands of organizations worldwide. Many HR teams still dread the end of the month because of the sheer friction involved in compiling workforce reports. The pain is usually rooted in a few systemic issues:
Siloed and Fragmented Data: HR data rarely lives in just one place. You might have payroll data in one system, applicant tracking (ATS) data in another, and employee performance reviews in a third. Merging these disparate data sources into a single, cohesive dashboard is a logistical nightmare.
The Excel Trap and Manual Errors: Many HR professionals still rely on exporting CSV files and manually manipulating them in Excel using VLOOKUPs and pivot tables. This manual process is incredibly prone to human error, meaning a single misplaced decimal can throw off an entire executive report.
Lack of Real-Time Insights: Because traditional reporting takes so much time to compile, the data is often obsolete by the time it is presented to the C-suite. You cannot make agile, proactive business decisions based on data that is three weeks old.
Steep Learning Curves of Traditional BI Tools: While powerful platforms like Tableau or PowerBI exist, they were built for data scientists, not HR professionals. Using them often requires a deep understanding of SQL, complex data modeling, and specialized training. When HR teams have to submit a ticket to the IT or Data team just to get a simple chart updated, a massive bottleneck is created.
Inflexible Reporting Structures: Standard reports generated by legacy HRIS systems are often rigid. If the Chief Executive Officer suddenly asks for a customized view of turnover rates specifically for middle managers in the engineering department over the last six months, generating that specific view on the fly is nearly impossible with traditional tools.
How to Build a Headcount and Hiring Dashboard From HR Data by Powerdrill Bloom
The good news is that the era of struggling with complex data modeling and rigid HR reports is over. Powerdrill Bloom is an AI-powered data exploration tool designed to democratize data analytics. It allows anyone, regardless of technical background, to interact with their data, generate stunning visualizations, and build interactive dashboards simply by using everyday language. Here is a step-by-step guide on how to go from raw HR data to a fully functional headcount and hiring dashboard in minutes.
Step 1. Upload Data to Powerdrill Bloom
The first step in building your dashboard is getting your raw data into the system. Powerdrill Bloom is built with user-friendliness in mind, meaning you do not need to set up complex API endpoints or data pipelines if you do not want to.
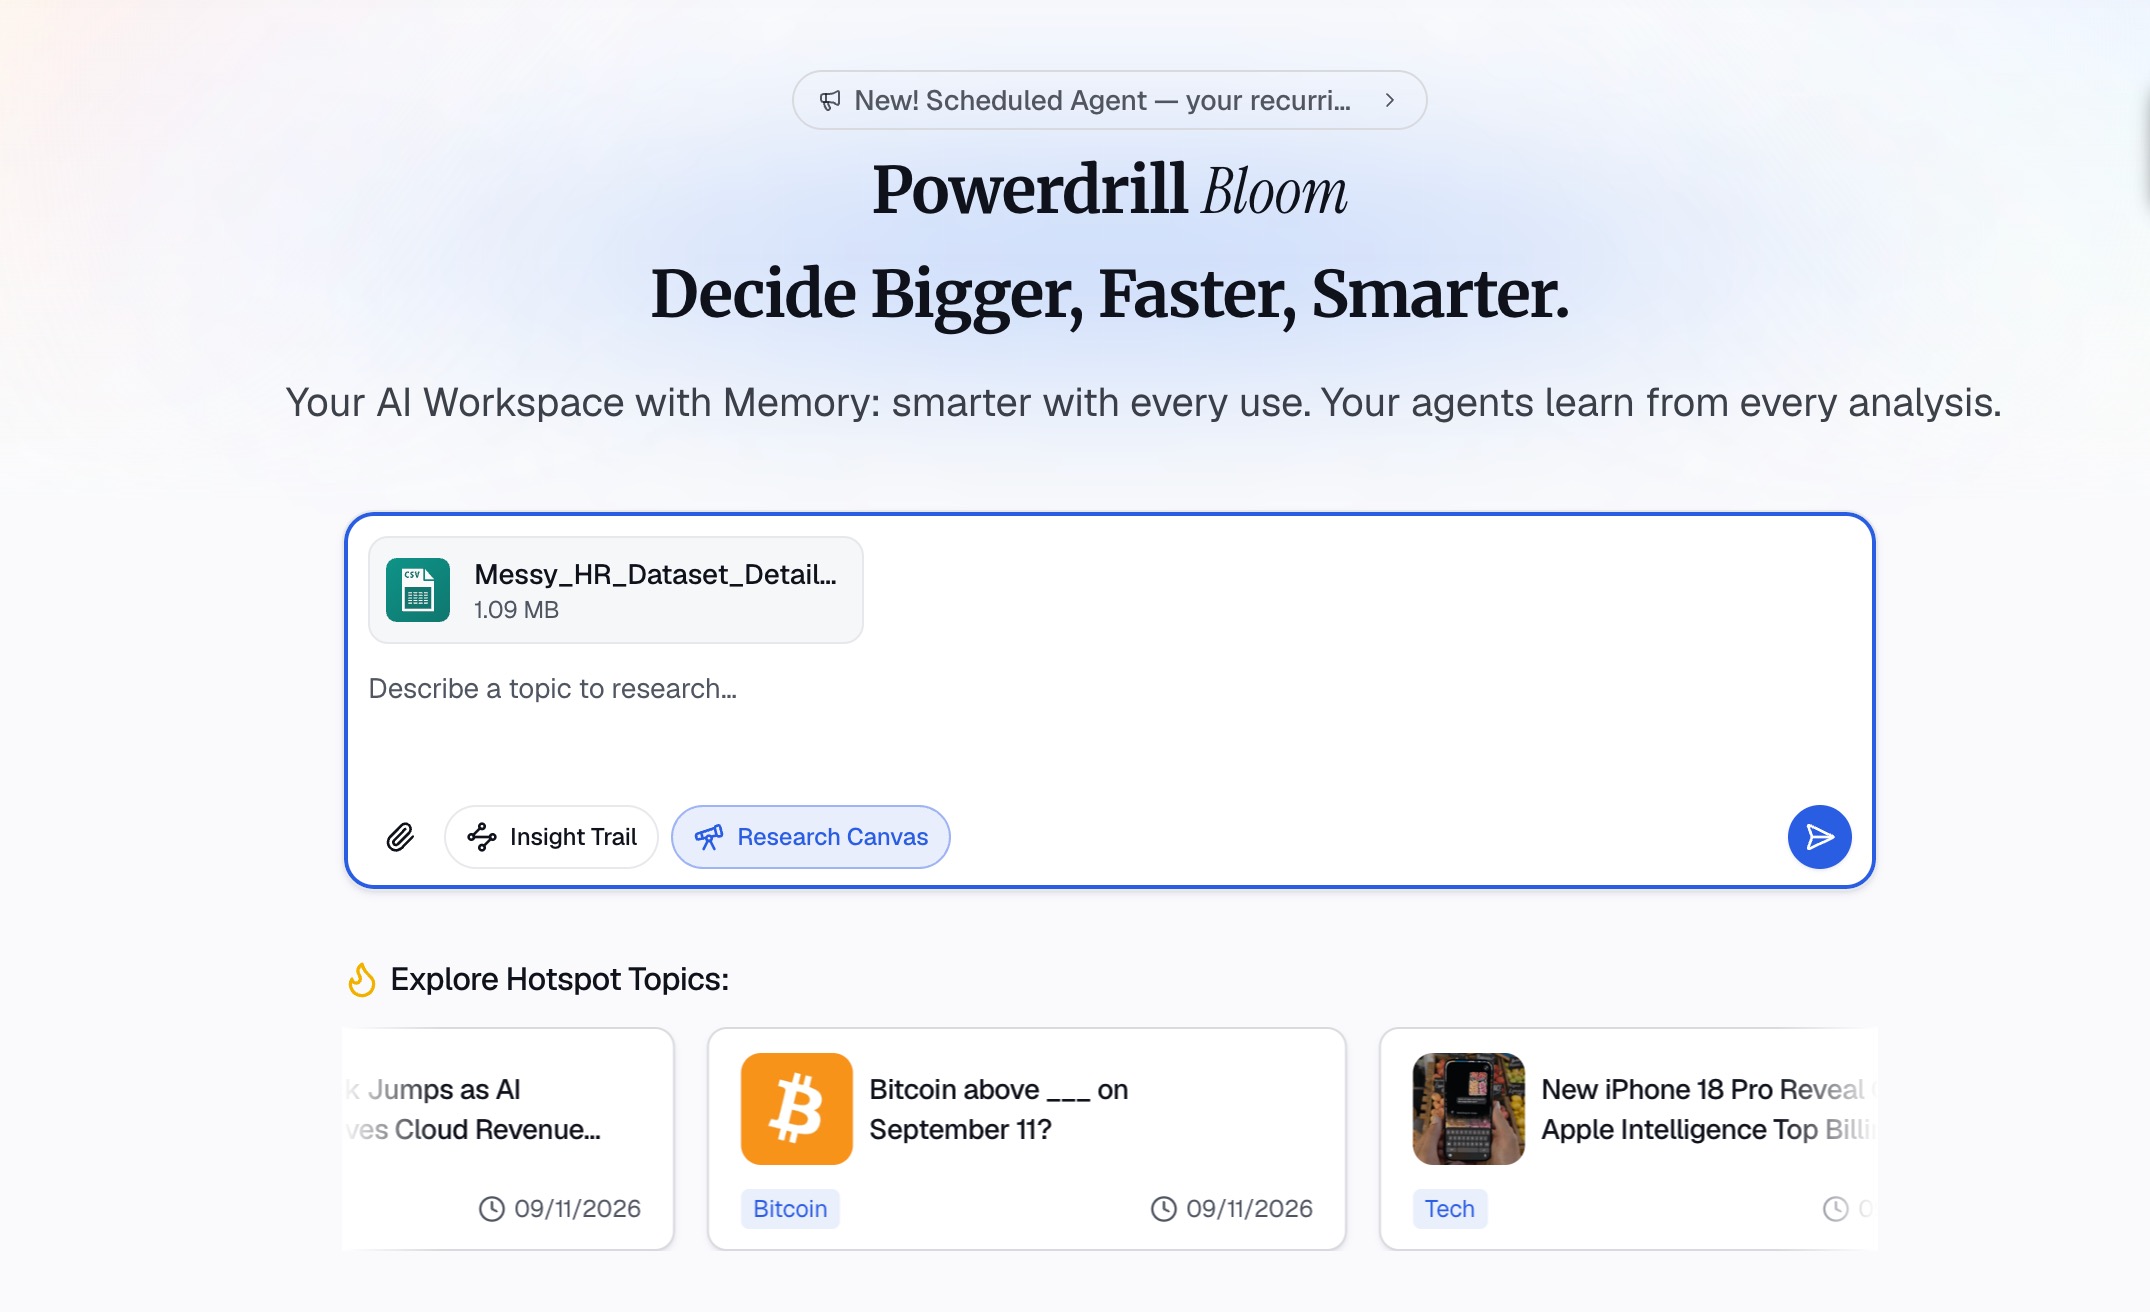
Start by gathering your raw HR data. This could be an export from your HRIS (like Workday, BambooHR, or Gusto) or your Applicant Tracking System (like Greenhouse or Lever). Ensure your dataset includes fundamental columns like Employee ID, Name, Department, Hire Date, Termination Date, Salary, Job Title, and Status.
Once your file is ready, simply drag and drop the CSV, Excel, or JSON file directly into the Powerdrill Bloom interface. The platform will automatically parse the data, recognizing dates as dates, numbers as numbers, and text as text. Bloom takes data security incredibly seriously, employing enterprise-grade encryption so you can feel confident that your sensitive employee data—such as salaries and performance metrics—is completely protected in an isolated environment.
Step 2. Choose Your Exploration Path
Once your data is successfully uploaded and parsed, Powerdrill Bloom gives you the flexibility to decide how you want to approach your analysis. You will be prompted to choose an exploration path based on your immediate needs and your comfort level with dashboard creation.
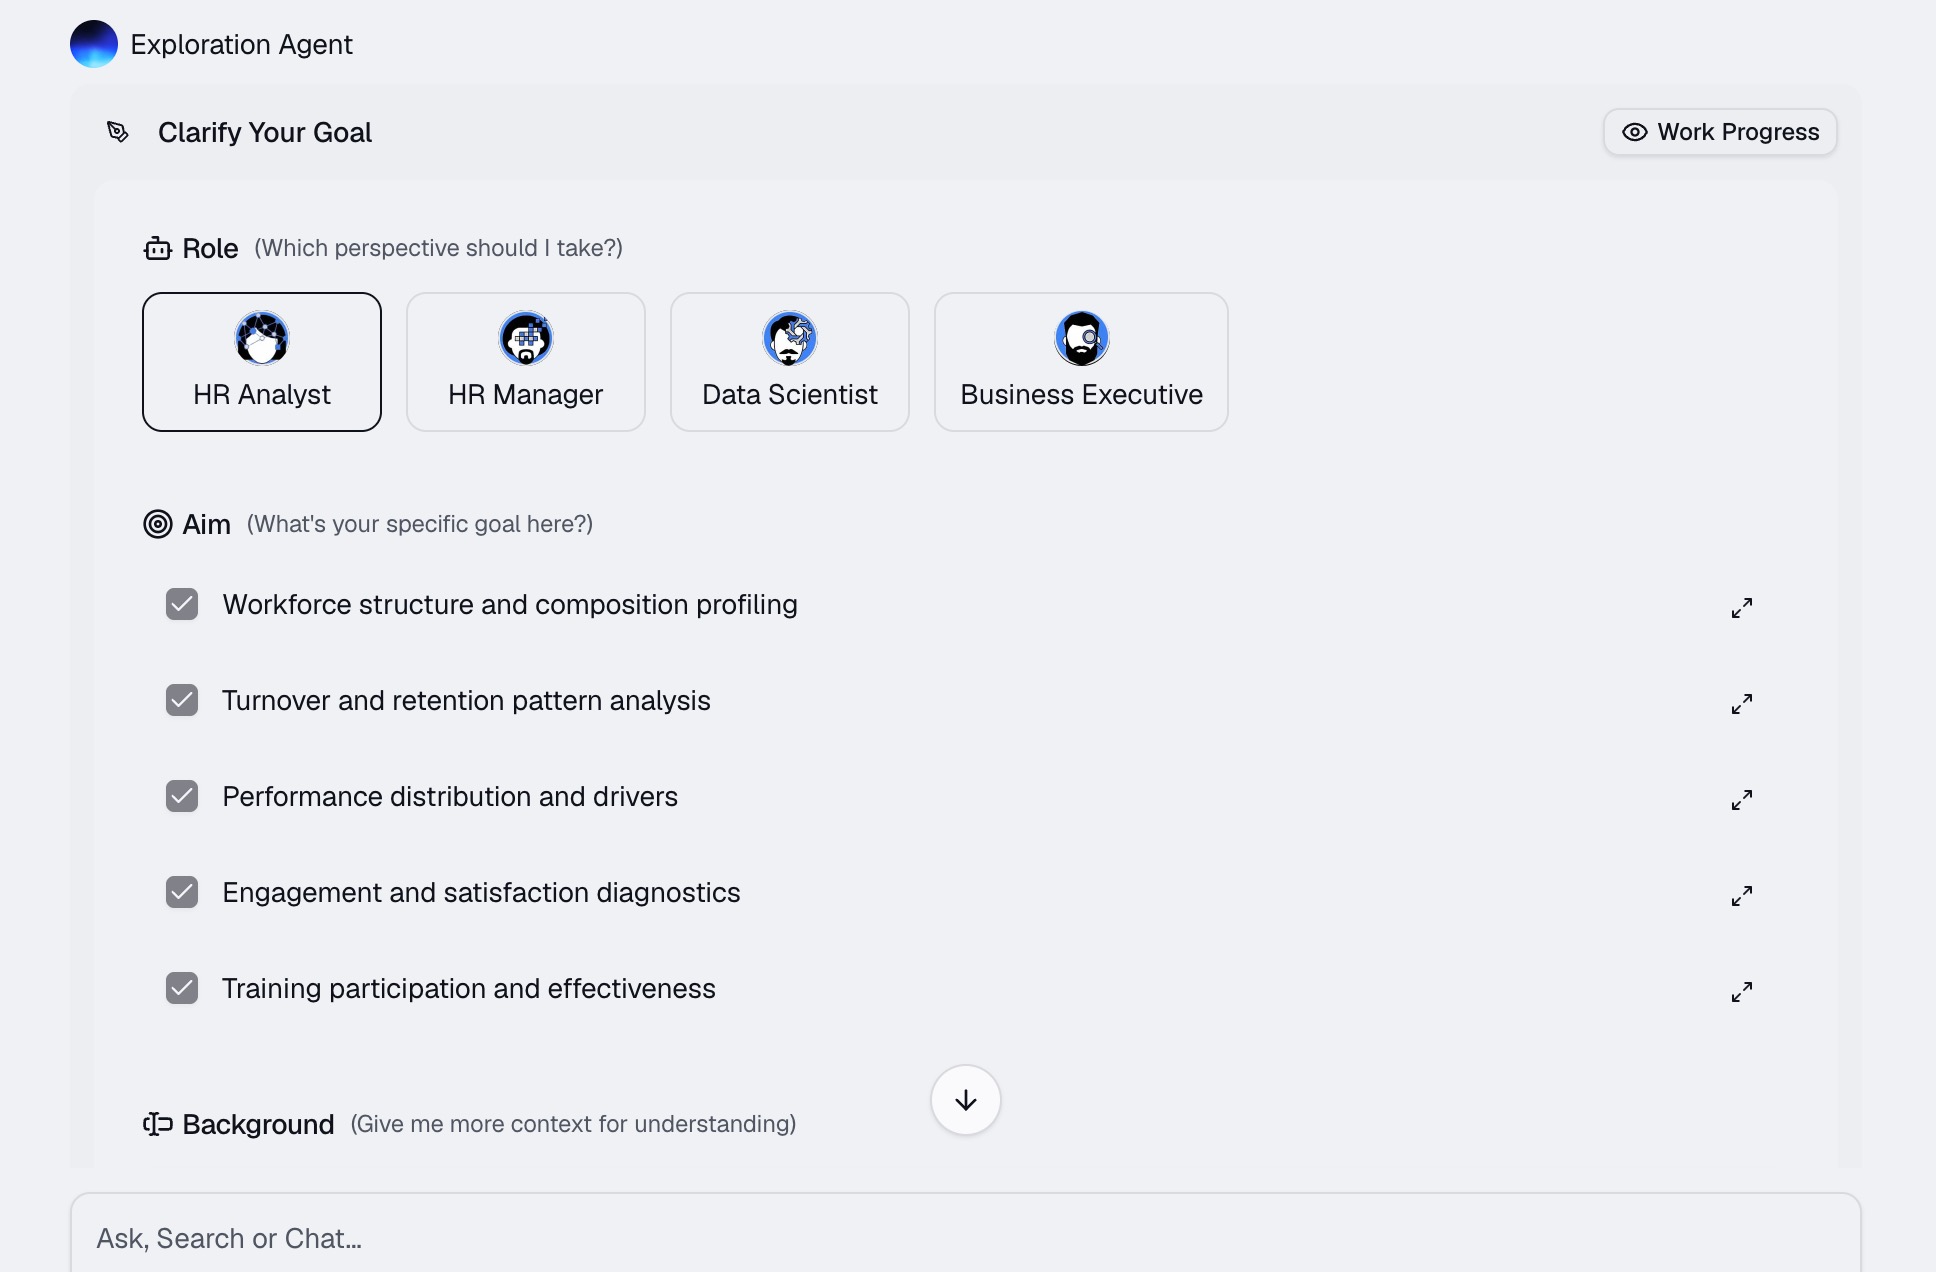
If you are in a rush or want some inspiration, you can select one of Bloom’s pre-built HR templates. These templates automatically map your uploaded columns to standard HR metrics, instantly generating a foundational dashboard with charts for total headcount, gender distribution, and average tenure.
Alternatively, if you have a highly specific vision for your reporting, you can choose to start from a blank canvas. Bloom’s AI engine will briefly scan your dataset and offer a list of "Suggested Questions" based on the data it sees. For instance, it might suggest, "Would you like to see the breakdown of hires by department for the last year?" This dual-path approach ensures that both beginners and seasoned HR analysts can hit the ground running without feeling overwhelmed.
Step 3. Ask Bloom by Natural Language
This is where the true magic of Powerdrill Bloom happens. Instead of dragging and dropping fields into a complex pivot table or writing SQL queries, you interact with your data just as you would with a human data analyst—by having a conversation.
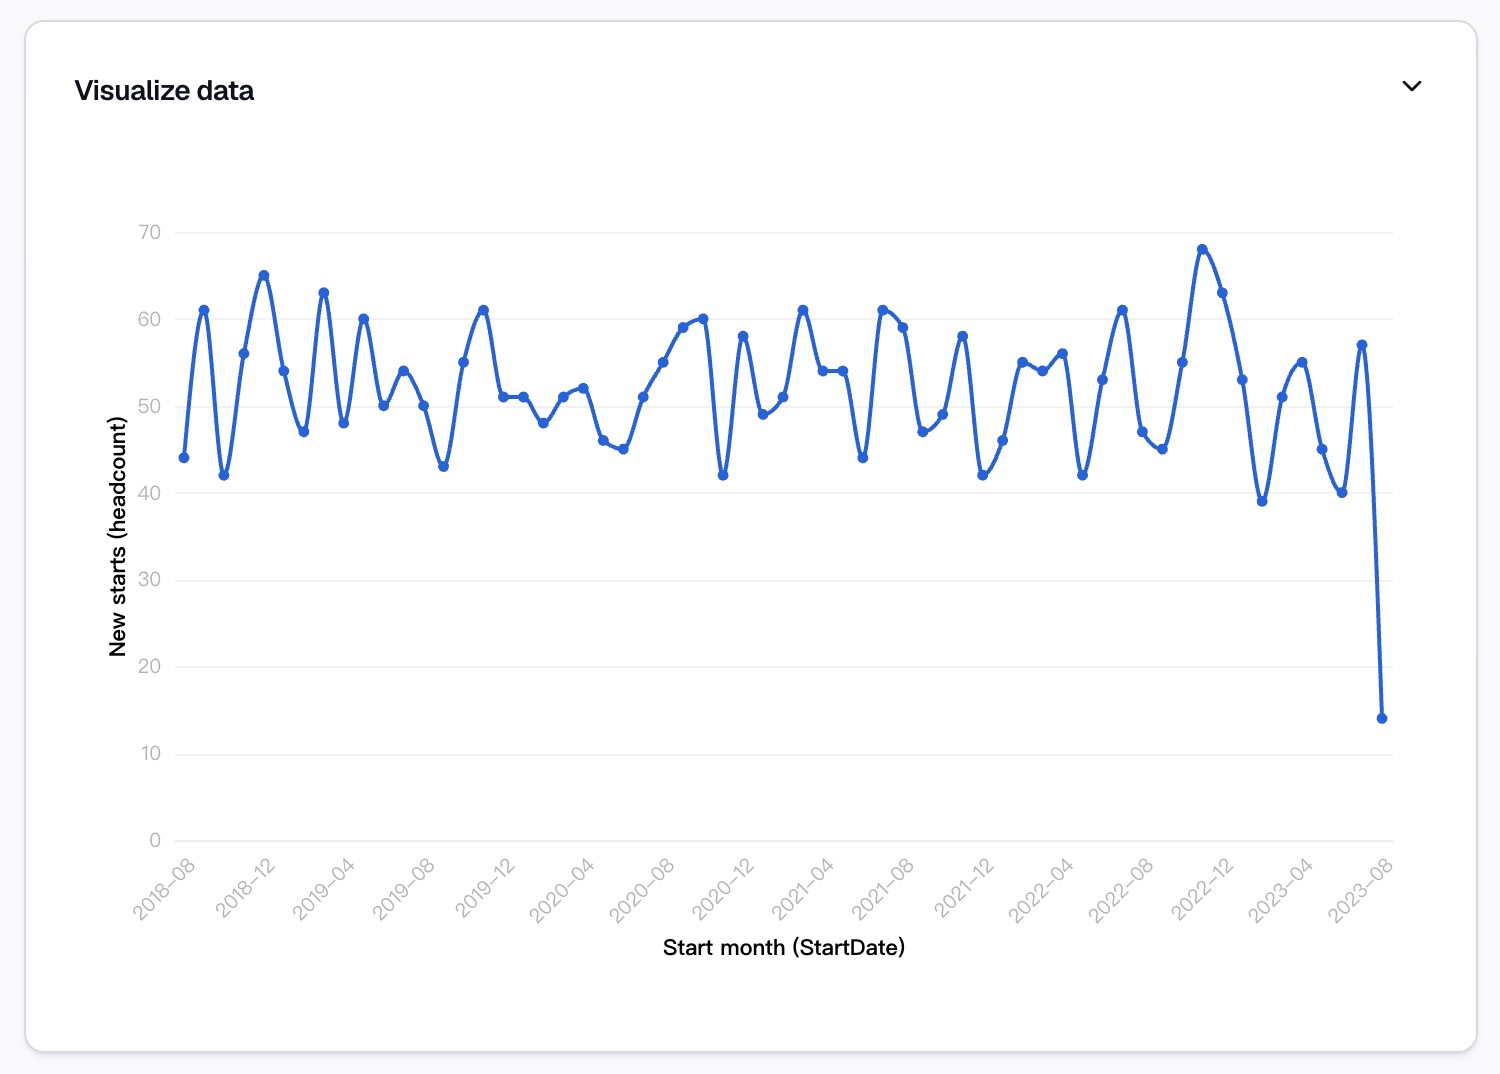
Navigate to the chat interface within Bloom and simply type your questions in natural English. For example, you can ask: "Show the headcount trend over time based on employee StartDate. Create a line chart by month."
Bloom’s advanced AI instantly understands the context of your question, processes the underlying HR data, and generates the exact visualization you need. If Bloom gives you a bar chart but you prefer a pie chart, you can simply type, "Change that to a pie chart," and the system will instantly update it.
As you ask these questions and generate visualizations, you can easily pin each chart to your central dashboard canvas. Because the AI handles the heavy lifting of data visualization, you can build out a highly complex, multi-layered dashboard covering attrition, hiring velocity, and compensation in mere minutes.
Step 4. Export and Share
Insights are only valuable if they can be communicated effectively to decision-makers. Once you have populated your Powerdrill Bloom dashboard with the necessary headcount and hiring charts, arranging them into a cohesive narrative is as simple as dragging the tiles around your screen to resize and organize them.
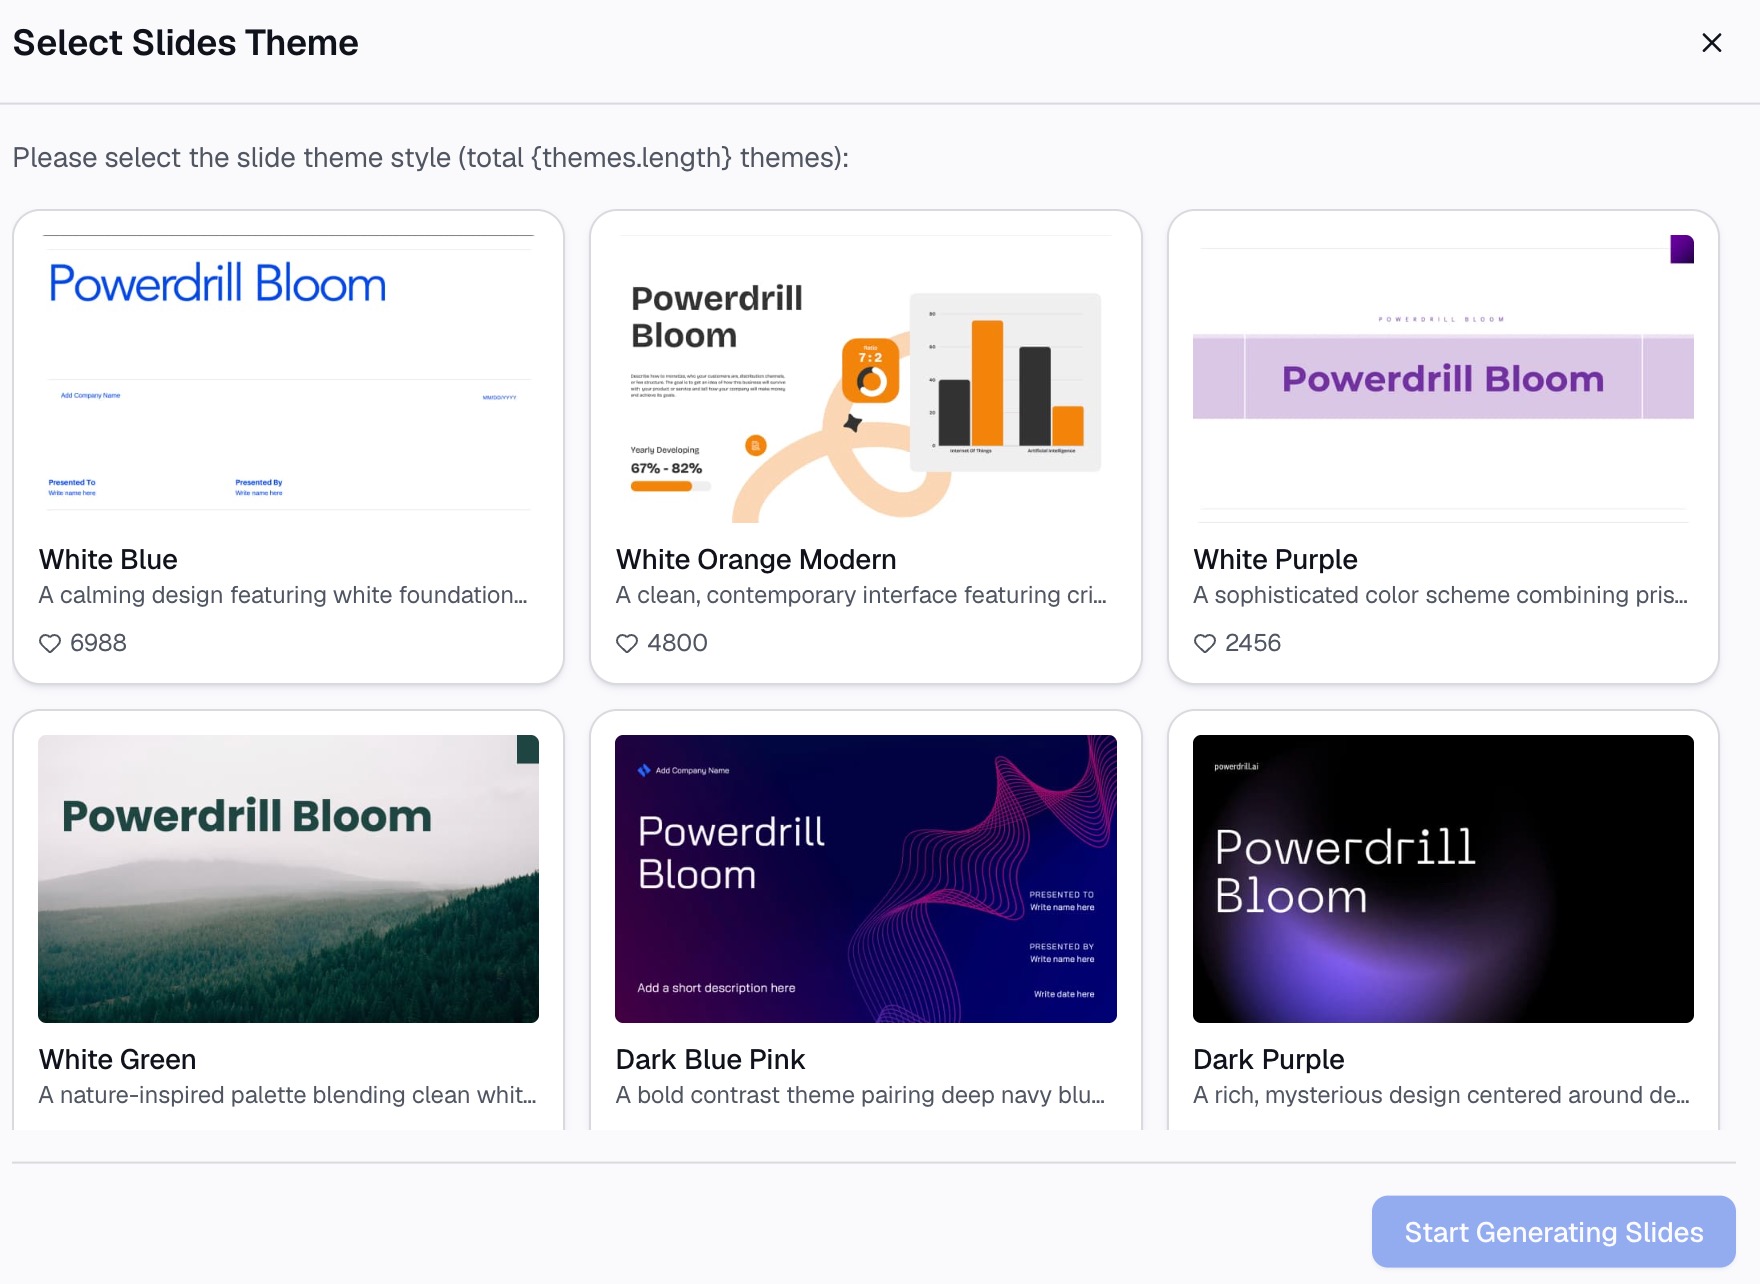
When it comes time for the quarterly executive review or the weekly HR sync, Bloom makes sharing effortless. If you need a static report, you can easily export the entire dashboard—or individual charts—as a high-resolution PDF or Image file, perfect for dropping directly into a PowerPoint presentation or an email.
If you want to provide a more interactive experience, you can generate a secure, dynamic sharing link. You can set specific access permissions, ensuring that only authorized stakeholders, such as the CEO or CFO, can view the dashboard. When they click the link, they will see a live, interactive version of the dashboard where they can hover over data points to see exact numbers, ensuring everyone is aligned on the latest workforce metrics.
Who Should Use Bloom for HR Reporting?
Powerdrill Bloom is designed to democratize data, making it an invaluable tool across the entire organizational spectrum. Here is a look at who stands to benefit the most from this technology:
HR Managers and Directors: Those responsible for the day-to-day management of human capital can use Bloom to instantly identify trends in attrition, track departmental growth, and present clear, data-backed reports to upper management without spending days in Excel.
Talent Acquisition (TA) Leads: Recruiters can monitor the health of their hiring pipelines, track time-to-fill, analyze source-of-hire effectiveness, and optimize their recruitment budgets to ensure they are attracting top talent quickly and cost-effectively.
C-Suite Executives and Founders: CEOs and CFOs need a macro view of the company’s biggest expense: its people. Bloom gives them direct access to top-level dashboards, allowing them to instantly see if headcount aligns with revenue goals and strategic objectives.
HR Data Analysts: Even for technical professionals, Bloom significantly accelerates workflow. Analysts can use the natural language interface for rapid prototyping and ad-hoc queries, freeing up their time to focus on deeper predictive analytics rather than manually building repetitive charts.
Conclusion
Navigating the complexities of workforce analytics does not have to be a painful, time-consuming process. By shifting away from rigid legacy systems and manual spreadsheets, you empower your HR team to focus on what truly matters: your people. Building a headcount and hiring dashboard is the first step toward transforming your HR department into a proactive, data-driven strategic powerhouse.
It is time to stop wrestling with pivot tables and start having meaningful conversations with your data. Ready to revolutionize your HR reporting and make workforce analytics effortless? Try Powerdrill Bloom today and turn your raw employee data into powerful, actionable insights in minutes.
FAQs
Is Powerdrill Bloom safe for sensitive HR data?
Yes, it uses enterprise-grade encryption and strict access controls to ensure your sensitive HR data remains completely secure.
Do I need coding skills to use Bloom?
Not at all. You can build complete dashboards using simple conversational English without writing a single line of code.
Can I integrate Bloom with my existing HRIS?
Yes, Bloom supports easy CSV/Excel uploads and integrates smoothly with popular HR Information Systems for seamless data syncing.
How fast can I build a dashboard?
With Bloom's natural language processing, you can generate a comprehensive HR dashboard from scratch in just a few minutes.
Can I share my dashboard with the executive team?
Absolutely. You can easily export your dashboard as a PDF or share a secure, interactive link with your stakeholders.