How to Build a Customer Segmentation Report From CSV Data (Actionable Guide)
You have a CSV file full of customer data. You know there are insights buried in there—different customer groups, distinct buying behaviors, segments that could unlock better marketing campaigns and higher retention. But turning that raw spreadsheet into a usable customer segmentation report? That's where most people get stuck.
Opening Excel. Staring at thousands of rows. Wondering where to start. Pivot tables, formulas, charts—hours of manual work before you've identified a single meaningful customer group. By the time the report looks halfway decent, your day is gone.
It doesn't have to be that way. With Powerdrill Bloom, you can go from a raw CSV file to a complete customer segmentation report in minutes—no SQL, no Python, no data science background required.
Here's exactly how to do it.
What Is Customer Segmentation, and Why Does It Matter?
Customer segmentation is the practice of dividing your customer base into distinct groups that share similar characteristics—demographics, purchasing behavior, engagement patterns, or lifetime value. Instead of treating all customers the same, segmentation lets you tailor marketing messages, product recommendations, and retention strategies to each group's specific needs.
The payoff is significant. Segmented campaigns consistently outperform generic ones. You stop wasting budget on messages that don't resonate and start delivering the right offer to the right person at the right time.
But the barrier has always been the same: segmentation traditionally requires data science skills, coding, or expensive tools. Not anymore.
What You'll Need Before You Start
A Powerdrill Bloom account (free beta available)
Your customer data in CSV or Excel format (sales data, CRM exports, transaction history, or any customer dataset)
A clear understanding of what you want to learn from your customers
Pro tip: The richer your data, the more valuable your segments will be. Include columns like purchase frequency, average order value, product categories, geographic location, and engagement metrics if available.
Step 1: Upload Your Data Directly on the Homepage
On the Bloom homepage, click input box and select your CSV or Excel file. Once uploaded, Bloom automatically detects the structure of your dataset—field types, column relationships, and data formats—without requiring any manual configuration.
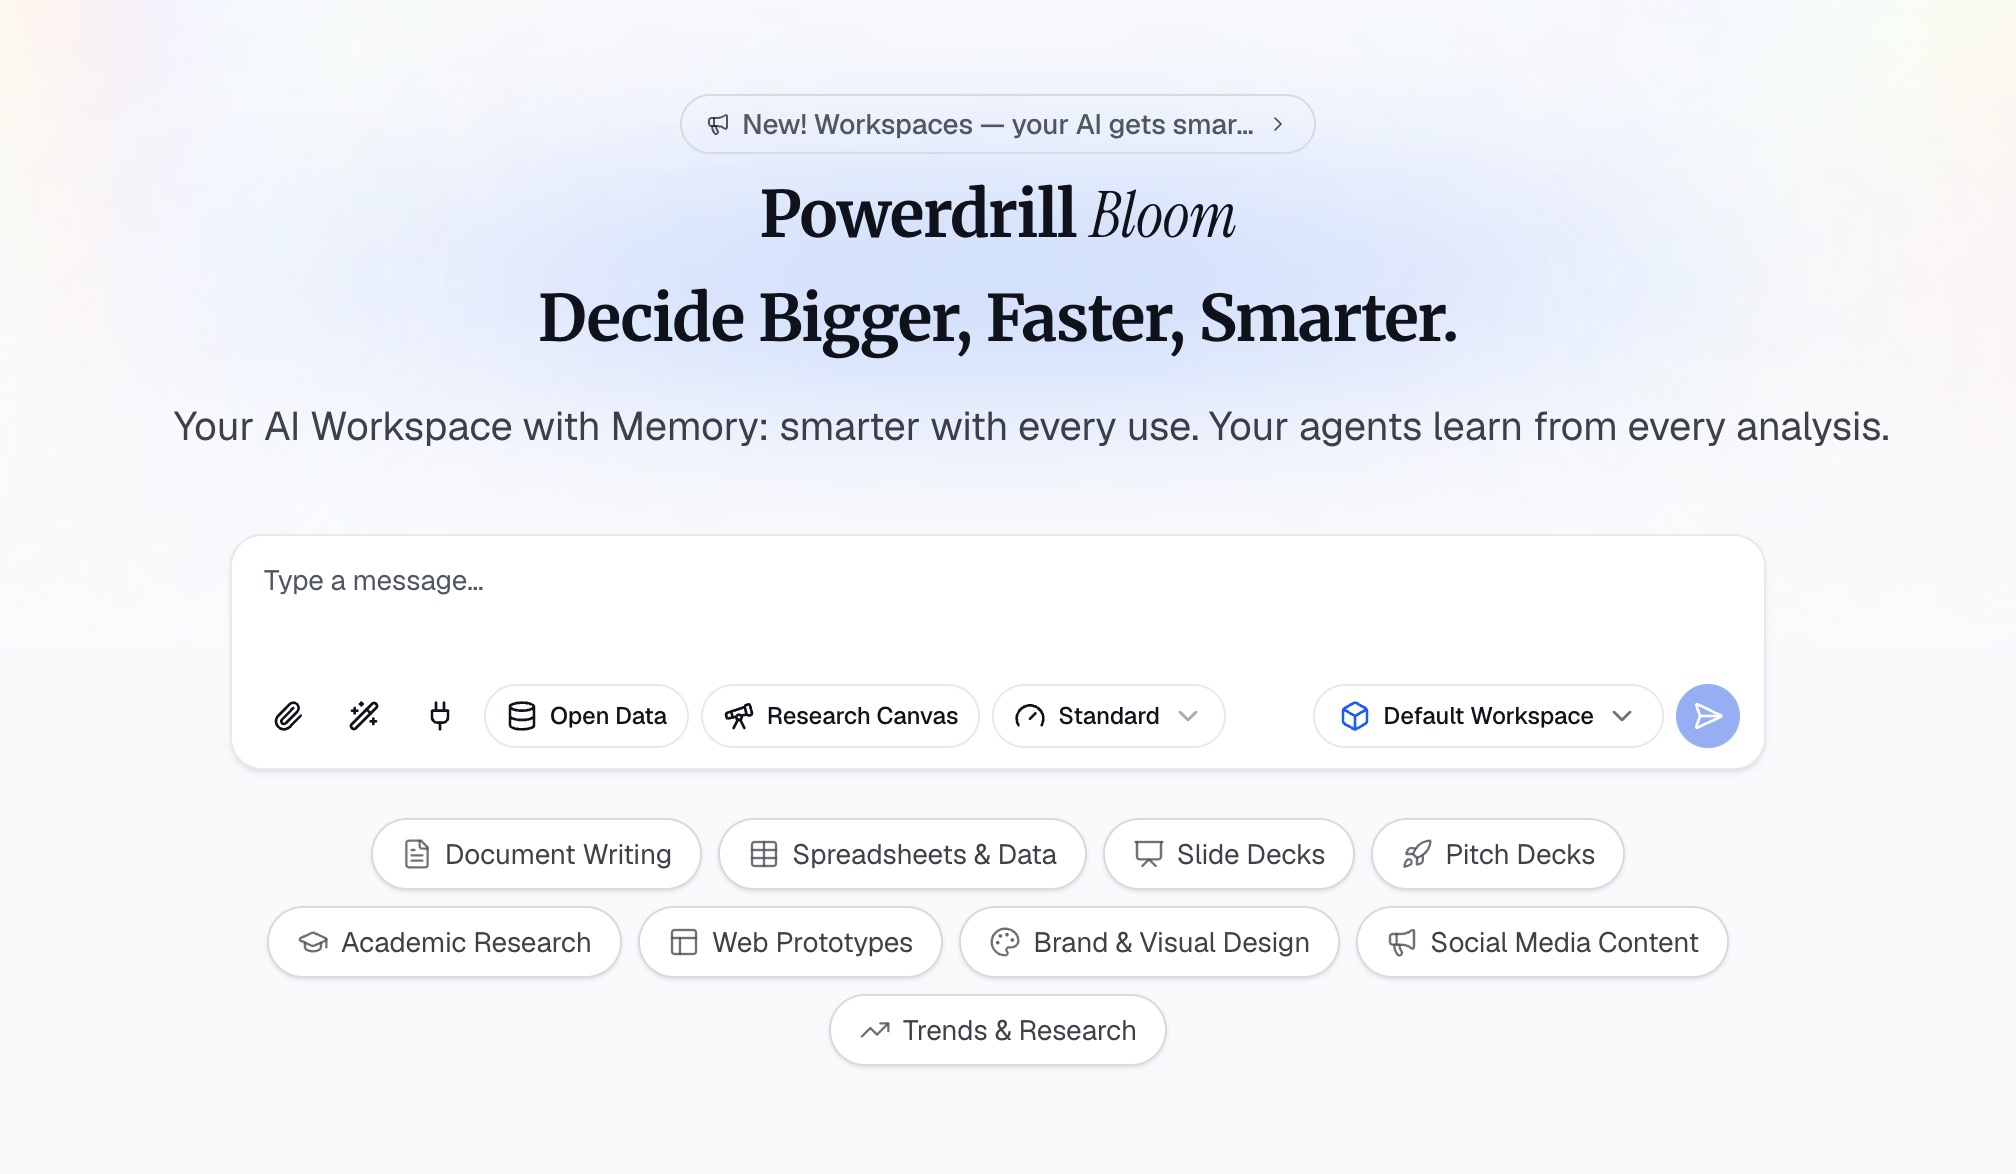
No SQL imports, no schema definitions, no formatting prep work. Just click, select, and upload.
Step 2: Tell Bloom What You Want in Plain Language
With your file uploaded, type your request directly into the input box—using natural language. For example: "Analyze this customer data and generate a customer segmentation report."
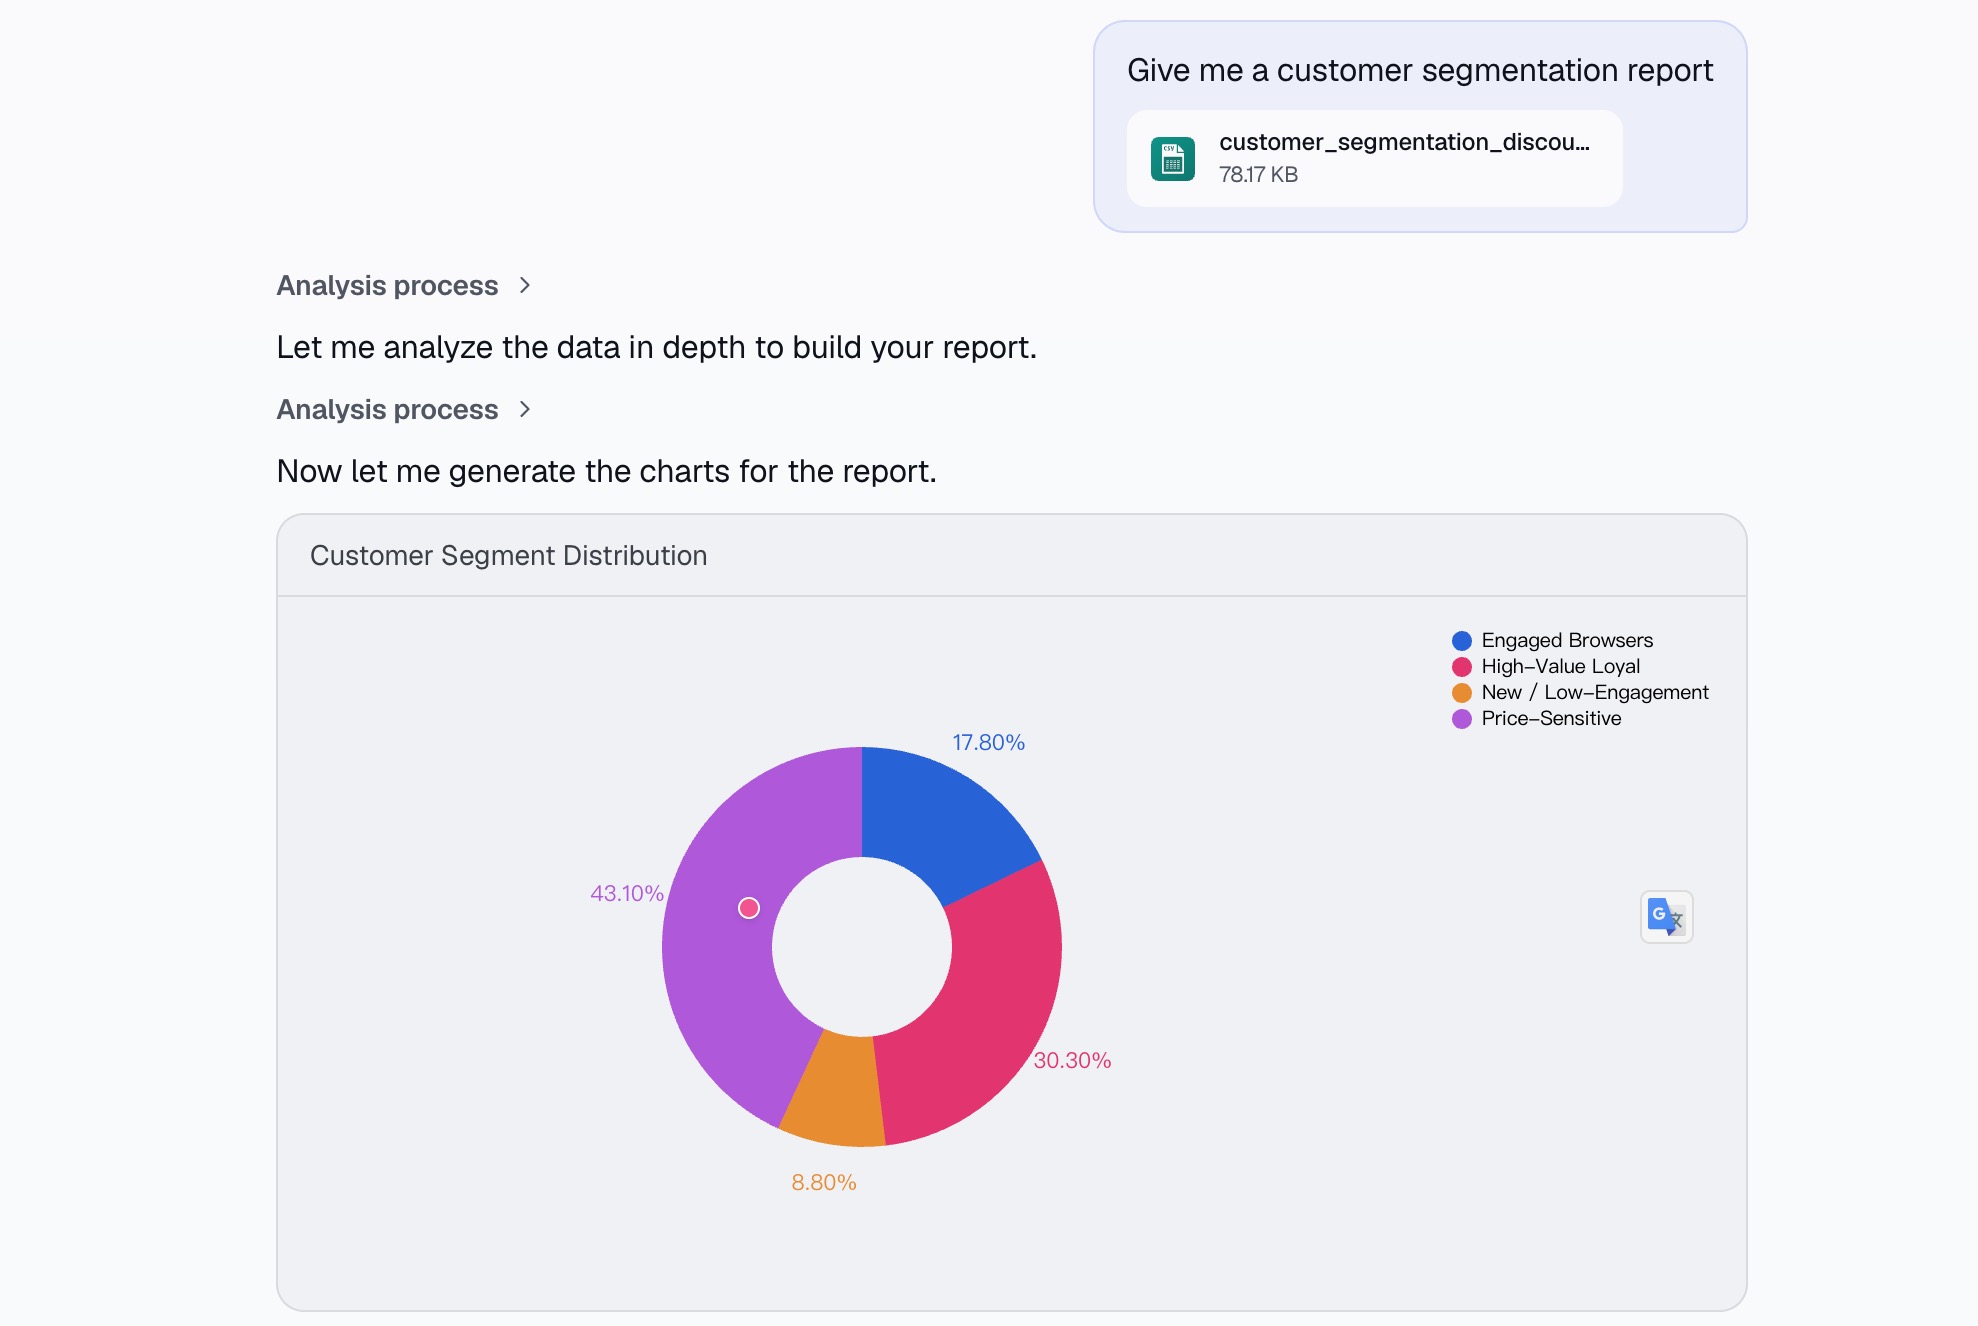
That's it. You don't need to specify which columns to use, what metrics to calculate, or what charts to generate. Bloom interprets your intent and determines the best analytical approach automatically.
Step 3: AI Automatically Explores and Analyzes Your Data
Bloom gets to work immediately. Behind the scenes, it:
Cleans and preprocesses the data
Identifies natural customer groupings based on behavioral and demographic patterns
Generates relevant visualizations (charts, tables, distribution graphs)
Surfaces key insights as insight cards on a visual canvas
Every finding is presented in a clear, digestible format. You don't need to dig through raw numbers or build pivot tables—Bloom does the heavy lifting for you.
Step 4: Generate a Complete Report With One Click
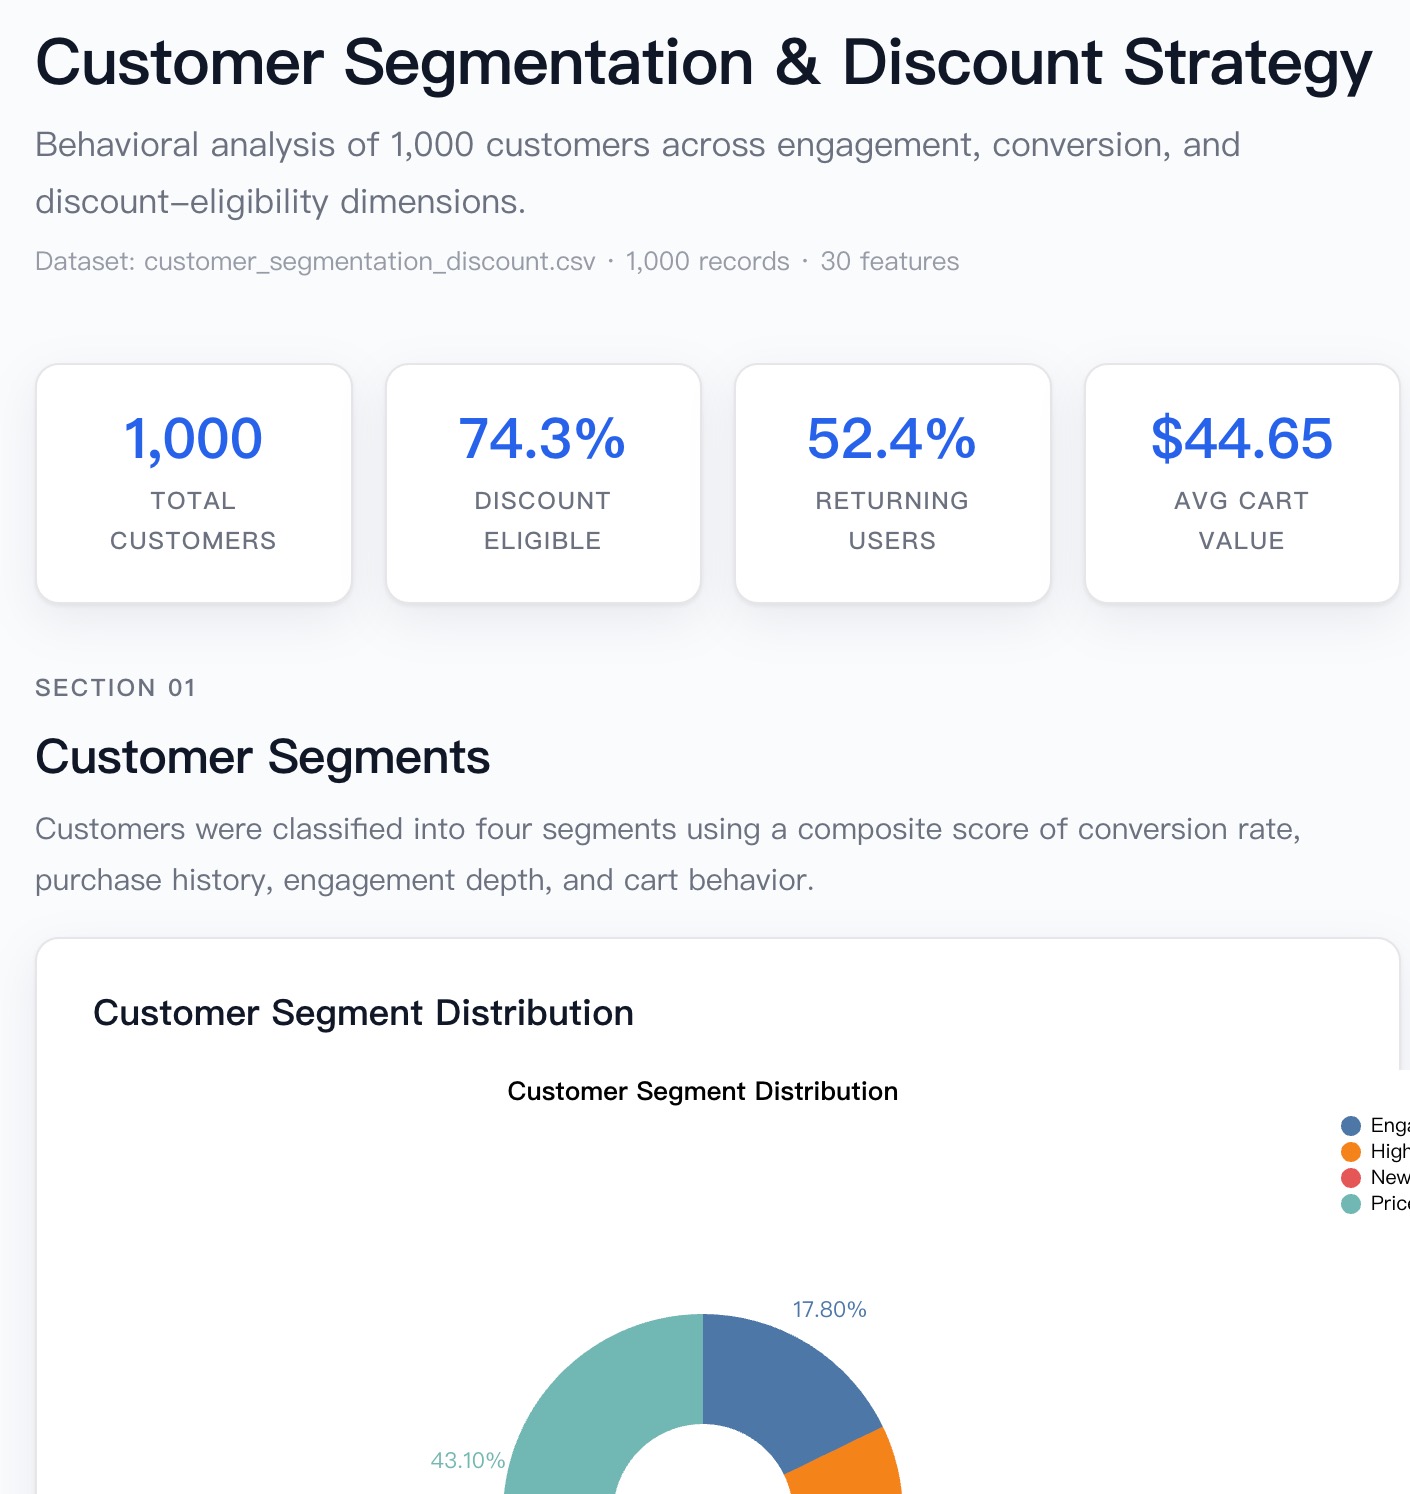
After Bloom completes its analysis, it doesn't just hand you a static file—it generates an interactive HTML report that brings your data to life. This isn't a plain document; it's a fully explorable dashboard where you can drill into segments, hover over charts for details, and interact with the visualizations directly.
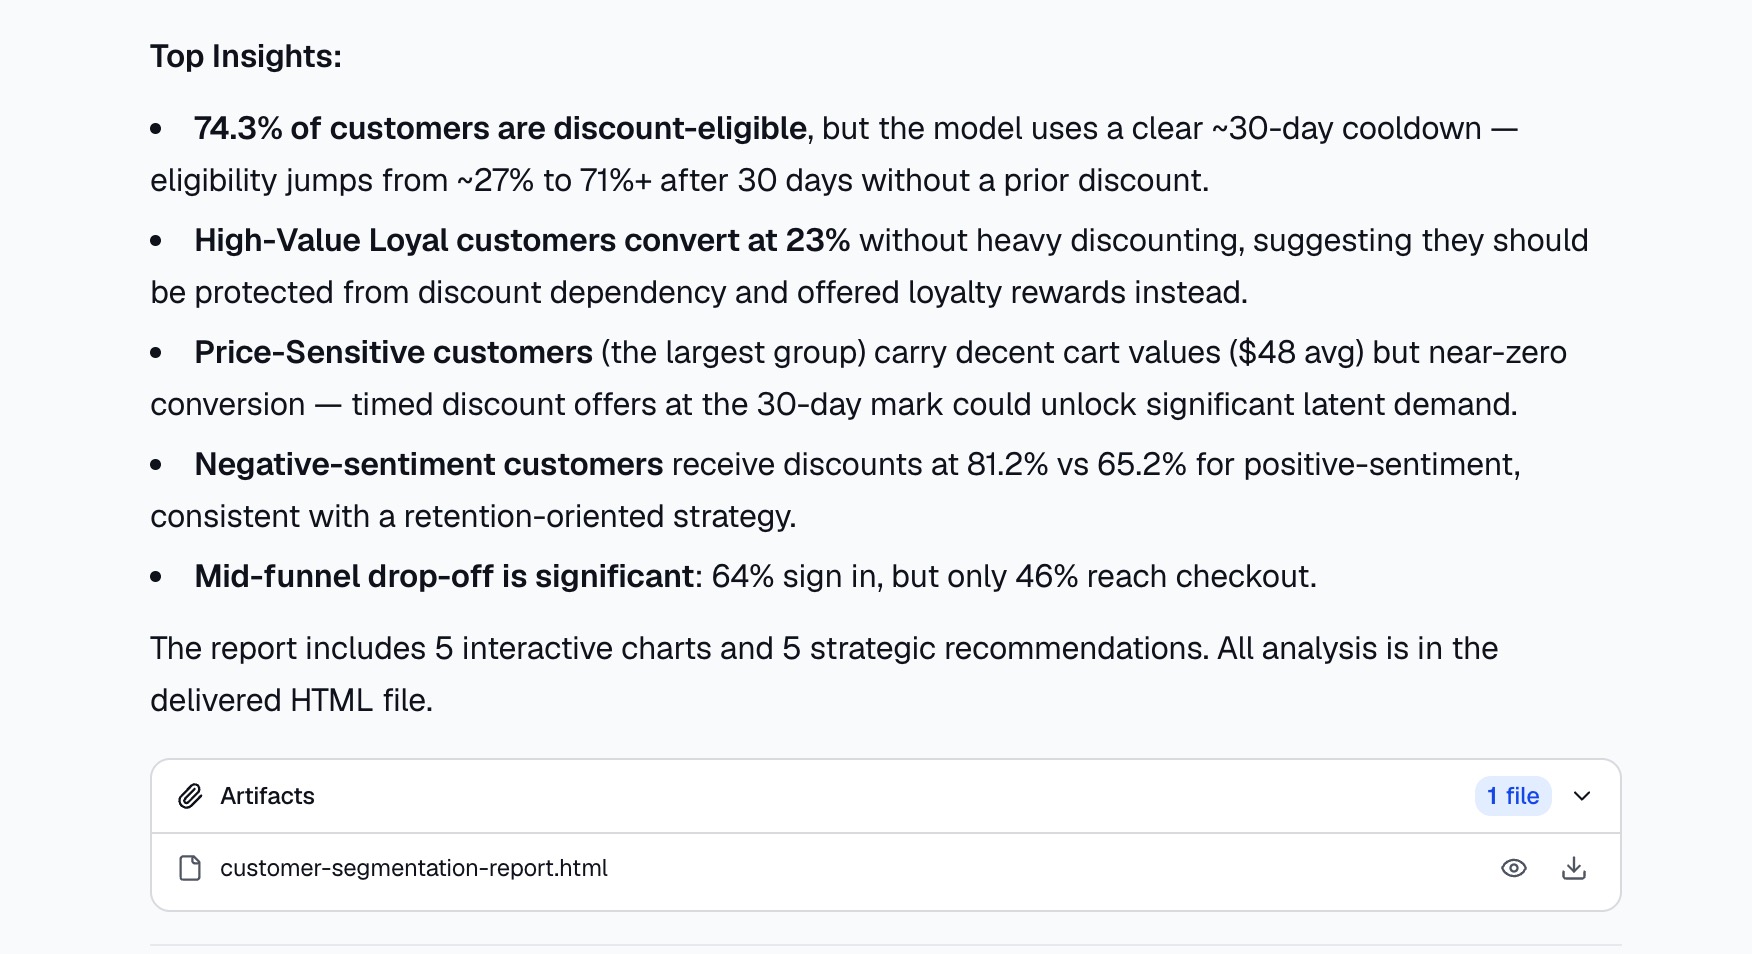
Review the insight cards and visualizations Bloom has surfaced on your canvas. Everything is presented in a clean, digestible format—no need to dig through raw numbers or rebuild charts yourself.
When you're ready to share your findings, the HTML report can be exported and opened in any browser, making it easy to distribute to stakeholders or present during meetings. The interactive format allows your team to explore the data on their own terms, not just view a static snapshot.
No manual copy-pasting, no reformatting, no last-minute design work. Just a complete, interactive analysis ready to share.
Why This Beats the Traditional Approach
No coding required. Traditional customer segmentation often requires Python (with libraries like scikit-learn and KMeans), SQL queries, or expensive BI tools. Bloom eliminates all of that.
No data science background needed. You don't need to understand clustering algorithms, feature scaling, or categorical variable encoding. The AI handles the technical work.
Speed that matters. Manual segmentation can take hours or days. Bloom delivers results in minutes.
Iteration is instant. If you want to explore a different angle or adjust your segments, you can run a new analysis in seconds—no rework required.
Your team can use it. Marketing, sales, product—anyone can run a segmentation analysis. No bottleneck waiting for data science resources.
A Practical Example
Imagine you're a marketing manager at an e-commerce company. You have a CSV export of customer transaction data—purchase history, average order value, frequency, product categories, and geographic location.
You upload the CSV to Bloom via the "Open Data" button. You type: "Analyze this customer data and generate a customer segmentation report." Within seconds, the AI identifies patterns: a group of high-frequency, high-value customers in urban areas; a segment of occasional buyers who respond to discounts; a group of new customers who haven't purchased again.
You review the insight cards, click "Generate Slides," and Bloom produces a report with visual breakdowns of each segment. You export to PowerPoint for tomorrow's strategy meeting.
Total time: under 20 minutes.
Pro Tips for Better Customer Segmentation
Start with clean data. The better your input data, the more valuable your segments. Remove duplicates, standardize categories, and ensure consistent formatting before uploading.
Include behavioral data. Demographics are useful, but behavioral data (purchase frequency, average order value, product preferences) creates more actionable segments.
Think about actionability. A segment is only useful if you can do something with it. Focus on groupings that inform marketing campaigns, product recommendations, or retention strategies.
Iterate and refine. Your first segmentation won't be your last. Use Bloom's speed to run multiple analyses and refine your segments over time.
Share broadly. Segmentation insights are most valuable when they're shared across teams. Use Bloom's export options to get your findings into the hands of marketing, sales, and product teams.
Conclusion
Customer segmentation doesn't have to be complicated. With Powerdrill Bloom, you can go from a raw CSV file to a complete, actionable segmentation report in minutes—no coding, no data science background, no manual drudgery.
The AI handles the heavy lifting: cleaning your data, identifying patterns, surfacing insights, and building visualizations. You focus on what matters: understanding your customers and making better decisions.
Your customer data tells a story. Let Bloom help you tell it.
Try Powerdrill Bloom today. Upload your first CSV and see how quickly raw data becomes actionable customer intelligence.
FAQs
Do I need to know how to code to build a customer segmentation report?
No. Bloom requires no SQL, Python, or data science skills—just upload your CSV and follow the steps above.
What kind of customer data can I use?
Any customer data in CSV or Excel format—sales data, CRM exports, transaction history, or marketing campaign data.
How long does the whole process take?
From upload to exportable report, expect 15-20 minutes for a standard customer segmentation analysis.
Can I customize the visual style of the report?
Yes. Choose from different templates and themes before generating your final report.
Is there a free version available?
Yes. Powerdrill Bloom offers a free beta with full access to data analysis and report generation features.