How to Analyze Subscription Revenue (MRR/ARR) From a CSV (Plain-Language Guide)
Running a subscription-based business, whether it is a thriving SaaS platform, a niche media publication, or a monthly box delivery service, is incredibly rewarding. The subscription model offers predictable income, builds long-term customer relationships, and provides a clear runway for growth. However, tracking the financial health of that business can often feel like navigating a complex maze blindfolded.
At the very heart of this financial health are two critical metrics: Monthly Recurring Revenue (MRR) and Annual Recurring Revenue (ARR). These numbers tell you exactly how much predictable revenue your business is generating. They are the lifeblood of your company, dictating everything from hiring decisions to marketing budgets. Investors want to see them, founders need to know them, and marketing teams rely on them to measure campaign success.
Yet, despite their importance, getting an accurate read on your MRR and ARR is rarely straightforward. More often than not, your payment gateway (like Stripe, PayPal, or Chargebee) spits out a massive, intimidating CSV file filled with thousands of rows of raw, unformatted transaction data. Turning that dense spreadsheet into actionable MRR and ARR insights is a daunting task that frustrates countless professionals. In this comprehensive, plain-English guide, we will explore why the traditional method of analyzing these files is deeply flawed, and how you can embrace a modernized, AI-driven approach to get your answers in seconds.
Why Analyzing MRR/ARR From a CSV Is Painful the Old Way
For decades, the standard procedure for analyzing subscription revenue has been to download a CSV file, open it in a traditional spreadsheet program like Microsoft Excel or Google Sheets, and start hacking away. If you have ever been tasked with this, you know that analyzing MRR/ARR the old way is an agonizing, time-consuming process.
Here is exactly why the traditional spreadsheet approach is so painful:
Manual Data Cleaning Nightmares: Raw CSV files rarely come out perfectly formatted. Dates might be in conflicting formats (MM/DD/YYYY vs. DD/MM/YYYY), currencies might include symbols that break formulas, and canceled subscriptions might still look like active rows. Before you can even do any math, you have to spend hours scrubbing, formatting, and standardizing the data.
Complex, Fragile Formulas: Calculating MRR isn't just about summing up a column. You have to account for upgrades (Expansion MRR), downgrades (Contraction MRR), and cancellations (Churned MRR). In a traditional spreadsheet, this requires a delicate house of cards built from nested IF statements, complex VLOOKUPs, and SUMIFS. If you make a single typo or reference the wrong cell, your entire revenue calculation breaks without warning.
Constant Repetition: The subscription business never sleeps, which means MRR and ARR are constantly changing. The old way forces you to repeat this tedious process of downloading, cleaning, and calculating every single month—or sometimes every week. It is an endless cycle of repetitive manual labor that drains your productivity.
High Risk of Human Error: When you are manually manipulating thousands of rows of financial data, human error is not just a possibility; it is an inevitability. A missed negative sign or a forgotten filter on a pivot table can result in wildly inaccurate revenue reports, which can lead to disastrous business decisions.
Version Control Chaos: Passing a heavy Excel file back and forth between the finance team, the CEO, and the marketing department inevitably leads to multiple versions of the "truth." Figuring out which file is the most updated MRR_Report_Final_v3_ACTUAL.csv is a logistical headache.
The Easy Way: Analyze MRR/ARR With Powerdrill Bloom
Thankfully, you no longer have to suffer through the spreadsheet grind. The modern, easy way to handle raw subscription data is by utilizing AI-powered data analysis tools. Leading the charge in this revolution is Powerdrill Bloom, an intelligent platform designed to act like a senior data analyst that lives right on your computer.
Instead of forcing you to write formulas or build manual pivot tables, Powerdrill Bloom allows you to interact with your data using plain, conversational English. Here is why analyzing your MRR/ARR with Powerdrill Bloom is a game-changer:
Conversational AI Interface: You don't need to know a single Excel formula or SQL query. You simply type questions like, "What was our total MRR for last month?" or "Show me the ARR growth over the last four quarters," and the AI instantly provides the answer.
Automated Data Processing: Powerdrill Bloom can ingest your messy CSV files, automatically understand the context of your columns (recognizing dates, customer IDs, and revenue amounts), and handle the underlying data structuring without you having to lift a finger.
Instant Visualizations: Humans are visual creatures, and numbers on a screen are hard to digest. Powerdrill Bloom instantly turns your MRR and ARR queries into beautiful, interactive charts, graphs, and dashboards, making it incredibly easy to spot trends and anomalies.
Deep, Contextual Insights: Beyond just giving you a final number, the AI can proactively identify underlying trends. It might tell you, "Your MRR grew by 15%, but your churn rate also spiked among enterprise users," giving you actionable business intelligence that a static spreadsheet never could.
How to Calculate MRR and ARR From a CSV
Transitioning from manual spreadsheets to an AI-powered workflow is incredibly simple. By following these four straightforward steps, you can turn a chaotic CSV into a crystal-clear revenue dashboard in mere minutes.
Step 1: Upload and Inspect Your CSV
The first step is exporting your raw subscription data from your payment processor (e.g., Stripe, Braintree) as a CSV file. Ensure your file contains the essential columns needed for revenue analysis, such as Customer ID, Subscription Amount, Billing Interval (monthly or yearly), Start Date, and Subscription Status (active, canceled, past due).
Once you have the file, simply drag and drop it into Powerdrill Bloom. The platform will take a few seconds to scan the document, categorize the data types, and present a clean preview of your dataset. It does the heavy lifting of parsing the file so you don't have to worry about broken formatting.

Step 2: Clarify Your Goal
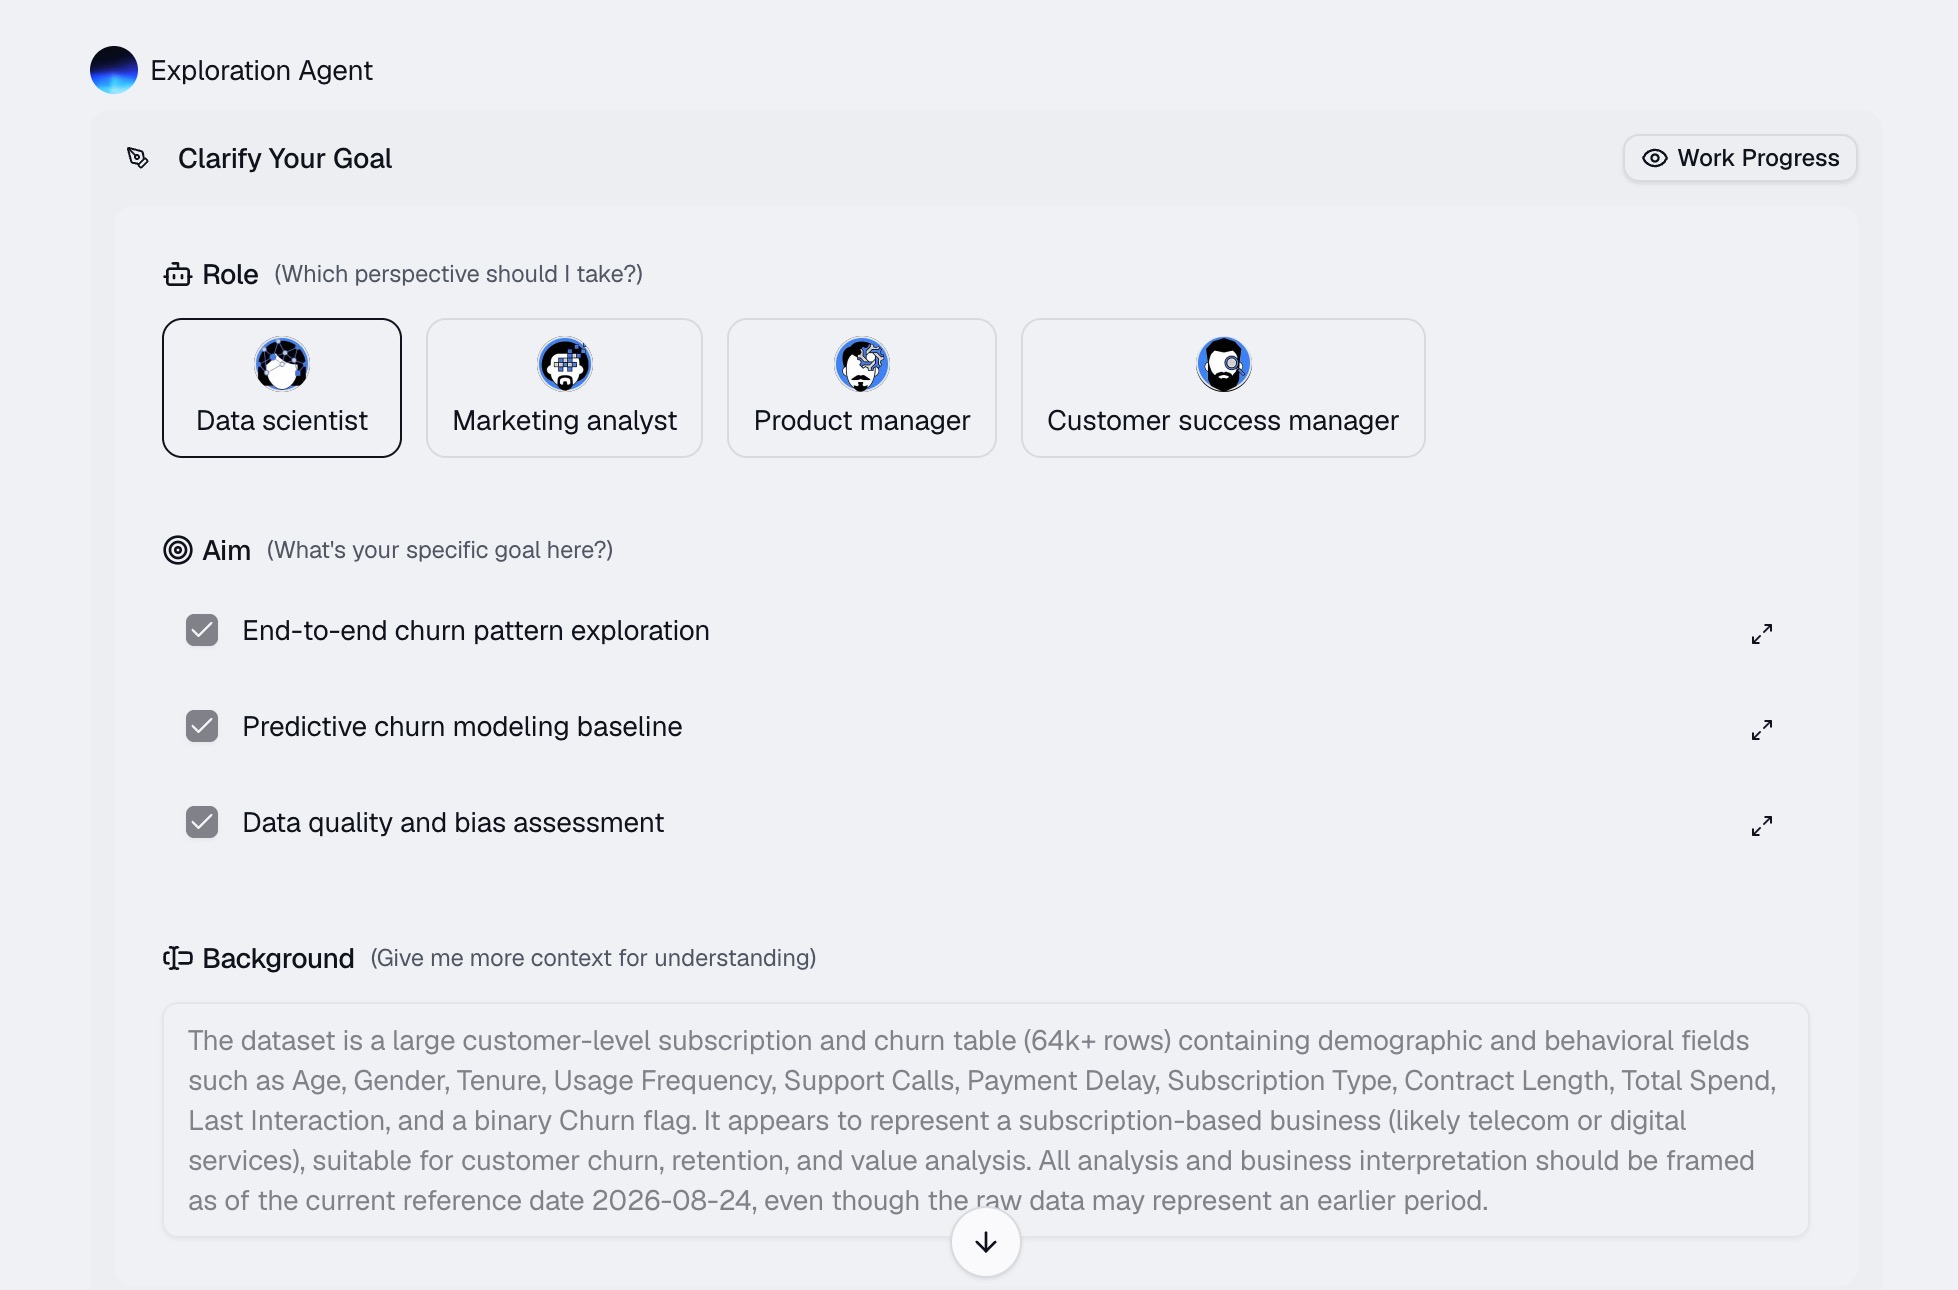
Before we dive into the data, let's get aligned on what you're trying to achieve. Choose the perspective that best fits your needs—data scientist, marketing analyst, product manager, or customer success manager—as it shapes how the AI interprets the data and what insights it prioritizes.
Then define your specific aim: end-to-end churn pattern exploration, predictive churn modeling baseline, or data quality and bias assessment. Select the one that matches what you want to walk away with, whether it's a full diagnostic, a modeling foundation, or a sanity check on your data.
Step 3: Let AI Generate MRR/ARR Visualizations and Insights
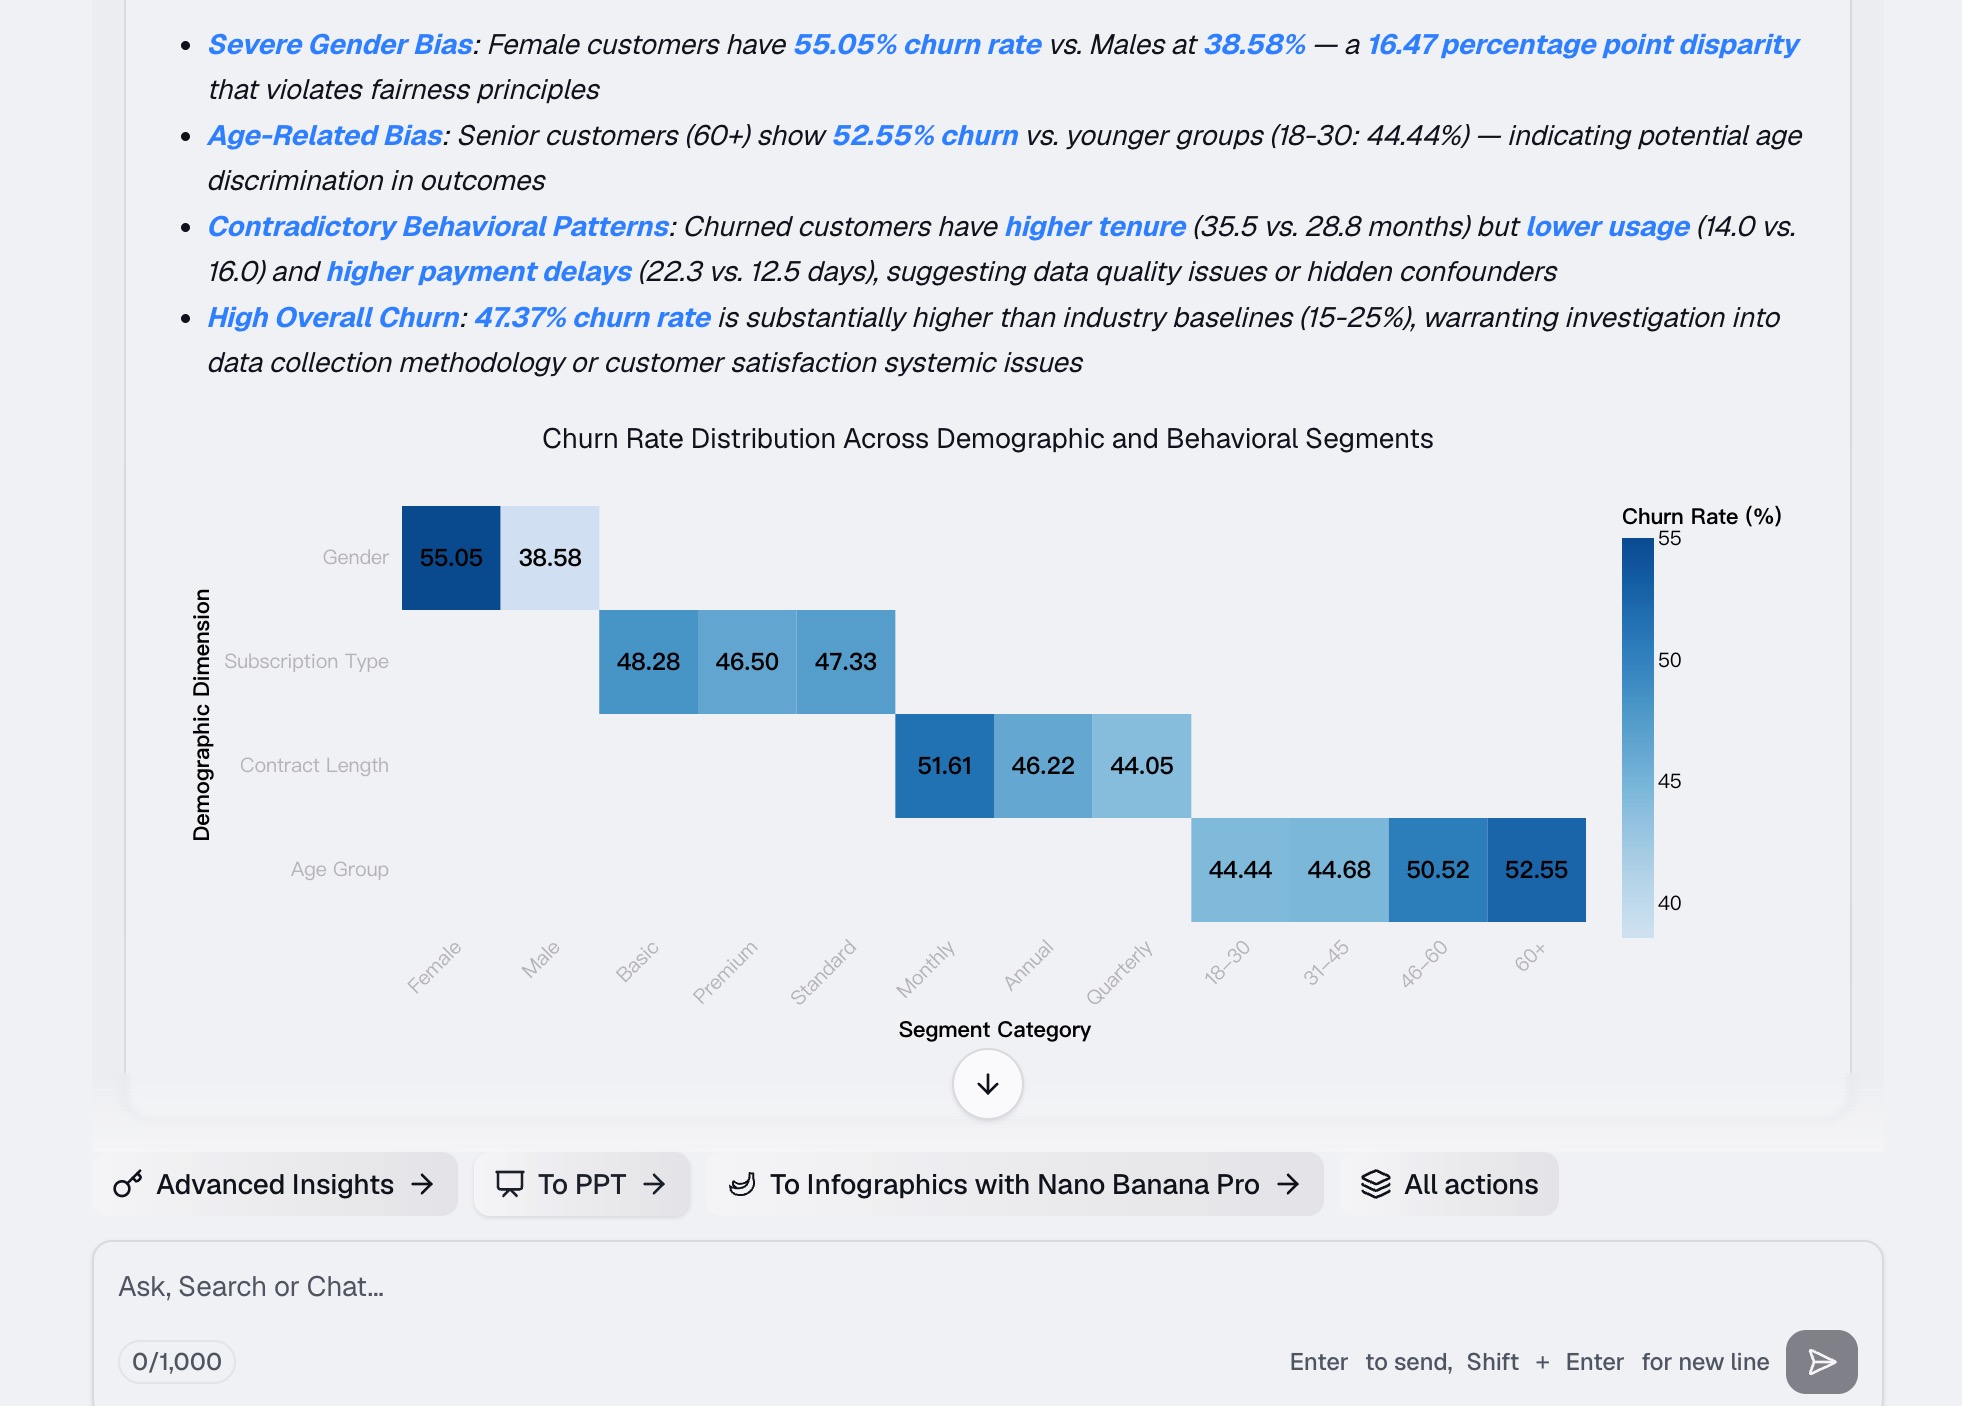
Now comes the magic. Instead of clicking through menus to build a pivot table, you simply type your request into Powerdrill Bloom's chat interface. You can prompt the AI with natural language requests such as: "Show me the churn rate by demographic dimensions in a bar chart_._"
The AI processes your CSV data instantly, performs the complex underlying math, and generates accurate, visually appealing charts. Furthermore, it often provides a brief text summary explaining the visualization, pointing out key growth periods or concerning spikes in churn.
Step 4: Export and Share Your Analysis
Data is only valuable if it can be shared with the people who need it. Once Powerdrill Bloom has generated your MRR and ARR insights, you can easily distribute them. Whether you need to download a high-resolution PNG of your MRR growth chart to drop into a PowerPoint deck, or export a clean summary report to share with your finance team via email, the platform makes sharing frictionless. You no longer have to email heavy, confusing spreadsheets; instead, you provide clear, definitive visual proof of your business's financial performance.

Why Powerdrill Bloom Beats Excel for MRR/ARR Analysis
Excel is undeniably a powerful tool, but it was built for a different era of data analysis. When it comes to rapidly extracting MRR and ARR metrics from raw subscription CSVs, an AI-native tool completely outclasses traditional spreadsheet software.
Here is a detailed look at why Powerdrill Bloom beats Excel in every category:
Unmatched Speed (Seconds vs. Hours): In Excel, calculating MRR involves setting up multiple helper columns, writing formulas to normalize annual plans to monthly values, and building pivot tables. This can take hours. In Powerdrill Bloom, you simply type your question and hit enter. The entire process takes seconds, saving you days of manual labor over the course of a year.
Zero Learning Curve for Non-Technical Users: To do advanced MRR analysis in Excel, you need to be an Excel power user. You need to understand INDEX MATCH, advanced filtering, and data validation. Powerdrill Bloom democratizes data. Because it uses plain English, anyone—from a creative marketing director to a busy CEO—can independently find the revenue numbers they need without waiting on a data analyst.
Dynamic, Interactive Insights (AI vs. Static Sheets): Excel is inherently static. It only does exactly what you program it to do. Powerdrill Bloom is intelligent. If you ask for MRR, it might automatically suggest looking at your churn rate or highlight a specific month where revenue dipped unexpectedly. It acts as an active partner in your analysis, rather than just a passive calculator.
Massive Error Reduction (AI Consistency vs. Manual Typos): Every time you manually drag a formula down 10,000 rows in Excel, you risk making a mistake. A single misaligned cell can throw off your ARR by thousands of dollars. Powerdrill Bloom processes the entire dataset systematically and consistently via code under the hood, virtually eliminating the risk of manual human error.
Effortless Scalability: Excel famously struggles, lags, and crashes when dealing with massive datasets (hundreds of thousands of rows). If you have a high-volume subscription business, traditional spreadsheets will buckle under the weight of your data. Powerdrill Bloom is built on modern cloud architecture, meaning it can seamlessly process massive CSV files without breaking a sweat or freezing your computer.
Final Thoughts
Understanding your Monthly Recurring Revenue and Annual Recurring Revenue is absolutely non-negotiable if you want to run a healthy, scaling subscription business. These metrics guide your strategy, validate your product-market fit, and keep your company alive. However, the days of suffering through the manual, error-prone, and soul-crushing process of calculating these numbers in traditional spreadsheets are officially over.
By embracing modern AI tools like Powerdrill Bloom, you can transform a raw, messy CSV file into brilliant, actionable financial insights in a matter of seconds. You bypass the complex formulas, eliminate the risk of human error, and free up your valuable time to do what you do best: actually growing your business, rather than just tallying up the score.
FAQs
1. What is MRR in SaaS?
MRR stands for Monthly Recurring Revenue. It represents the predictable, normalized revenue a subscription business expects to receive every single month.
2. How is ARR different from MRR?
ARR is Annual Recurring Revenue. It is simply your current Monthly Recurring Revenue (MRR) multiplied by twelve to project yearly income.
3. Can I use a regular CSV for MRR analysis?
Yes. You can export a standard CSV from Stripe or Chargebee and use AI tools to analyze it directly.
4. Is Powerdrill Bloom safe for my financial data?
Yes, Powerdrill Bloom employs strict data privacy protocols and encryption to ensure your sensitive financial CSV data remains highly secure.
5. Do I need to know SQL to use Powerdrill Bloom?
No, you do not need SQL. You can query your data and generate charts using simple, conversational, plain-English text prompts.