How to Analyze Customer Churn From a CSV (Simple Steps)
Introduction
In today’s hyper-competitive business landscape, acquiring a new customer is often five to twenty-five times more expensive than retaining an existing one. Despite this well-known fact, many businesses still struggle to keep their subscribers and buyers engaged over the long term. If you are noticing a drop in your user base or a dip in recurring revenue, you are likely facing a customer churn problem. Fortunately, you don’t need an entire data science team or complex coding skills to understand why your customers are leaving.
The secret to unlocking powerful retention strategies lies in the data you already have. By simply exporting your customer data into a standard CSV file, you hold the key to uncovering hidden trends, identifying at-risk accounts, and taking proactive measures. With the rise of intuitive AI data analysis tools, extracting actionable insights from raw data has never been easier. In this comprehensive guide, we will walk you through everything you need to know about customer churn, provide a step-by-step tutorial on analyzing it using a CSV file, and show you how modern tools can automate the heavy lifting for you.
What Is Customer Churn Analysis
Customer churn analysis is the systematic process of evaluating your customer data to understand how many customers are leaving your business, why they are leaving, and what you can do to stop them. Instead of just looking at the overall churn rate (the percentage of customers lost over a specific period), a proper analysis dives deep into the underlying behavioral patterns and demographics of the departing users.
To truly grasp the value of customer churn analysis, it helps to break it down into a few core components:
Identifying the Churn Rate: This is the baseline metric of your analysis. It tells you the exact percentage of your customer base that has canceled their subscriptions, failed to renew their contracts, or stopped purchasing your products within a given timeframe (e.g., monthly or annually).
Understanding the "Why": Churn analysis goes beyond numbers to uncover the root causes of customer attrition. By looking at variables in your data—such as customer support ticket volume, product usage frequency, or demographic information—you can pinpoint the exact friction points that drive users away.
Predicting Future Churn: Advanced churn analysis allows you to identify "at-risk" behaviors before the customer actually leaves. For example, if a user’s login frequency drops by 50% over two months, the analysis can flag them so your customer success team can intervene.
Segmenting Customer Loss: Not all churn is created equal. Churn analysis helps you segment departing customers by their Lifetime Value (LTV). Losing ten customers on a basic $5/month plan requires a different response than losing two enterprise clients paying $500/month.
Evaluating Retention Strategies: By continuously analyzing churn over time, businesses can measure the effectiveness of new features, pricing changes, or marketing campaigns, ensuring that retention efforts are actually working.
Step-by-Step: How to Analyze Customer Churn From a CSV
Step 1: Upload Your CSV File
The first step in your analysis journey is getting your raw data into your analytics platform. Start by exporting your customer data from your CRM (like Salesforce or HubSpot), payment gateway (like Stripe), or internal database. Ensure your CSV file includes critical columns. Once your data is clean and ready, navigate to your AI analytics tool. Simply drag and drop your CSV file into the designated upload area.

Step 2: Clarify Your Goal
Raw data is useless without a clear objective. Before you start generating random charts, you need to clarify what you are trying to find. Are you trying to find out which subscription tier has the highest cancellation rate? Or perhaps you want to know if customers from a specific geographic region churn faster than others?
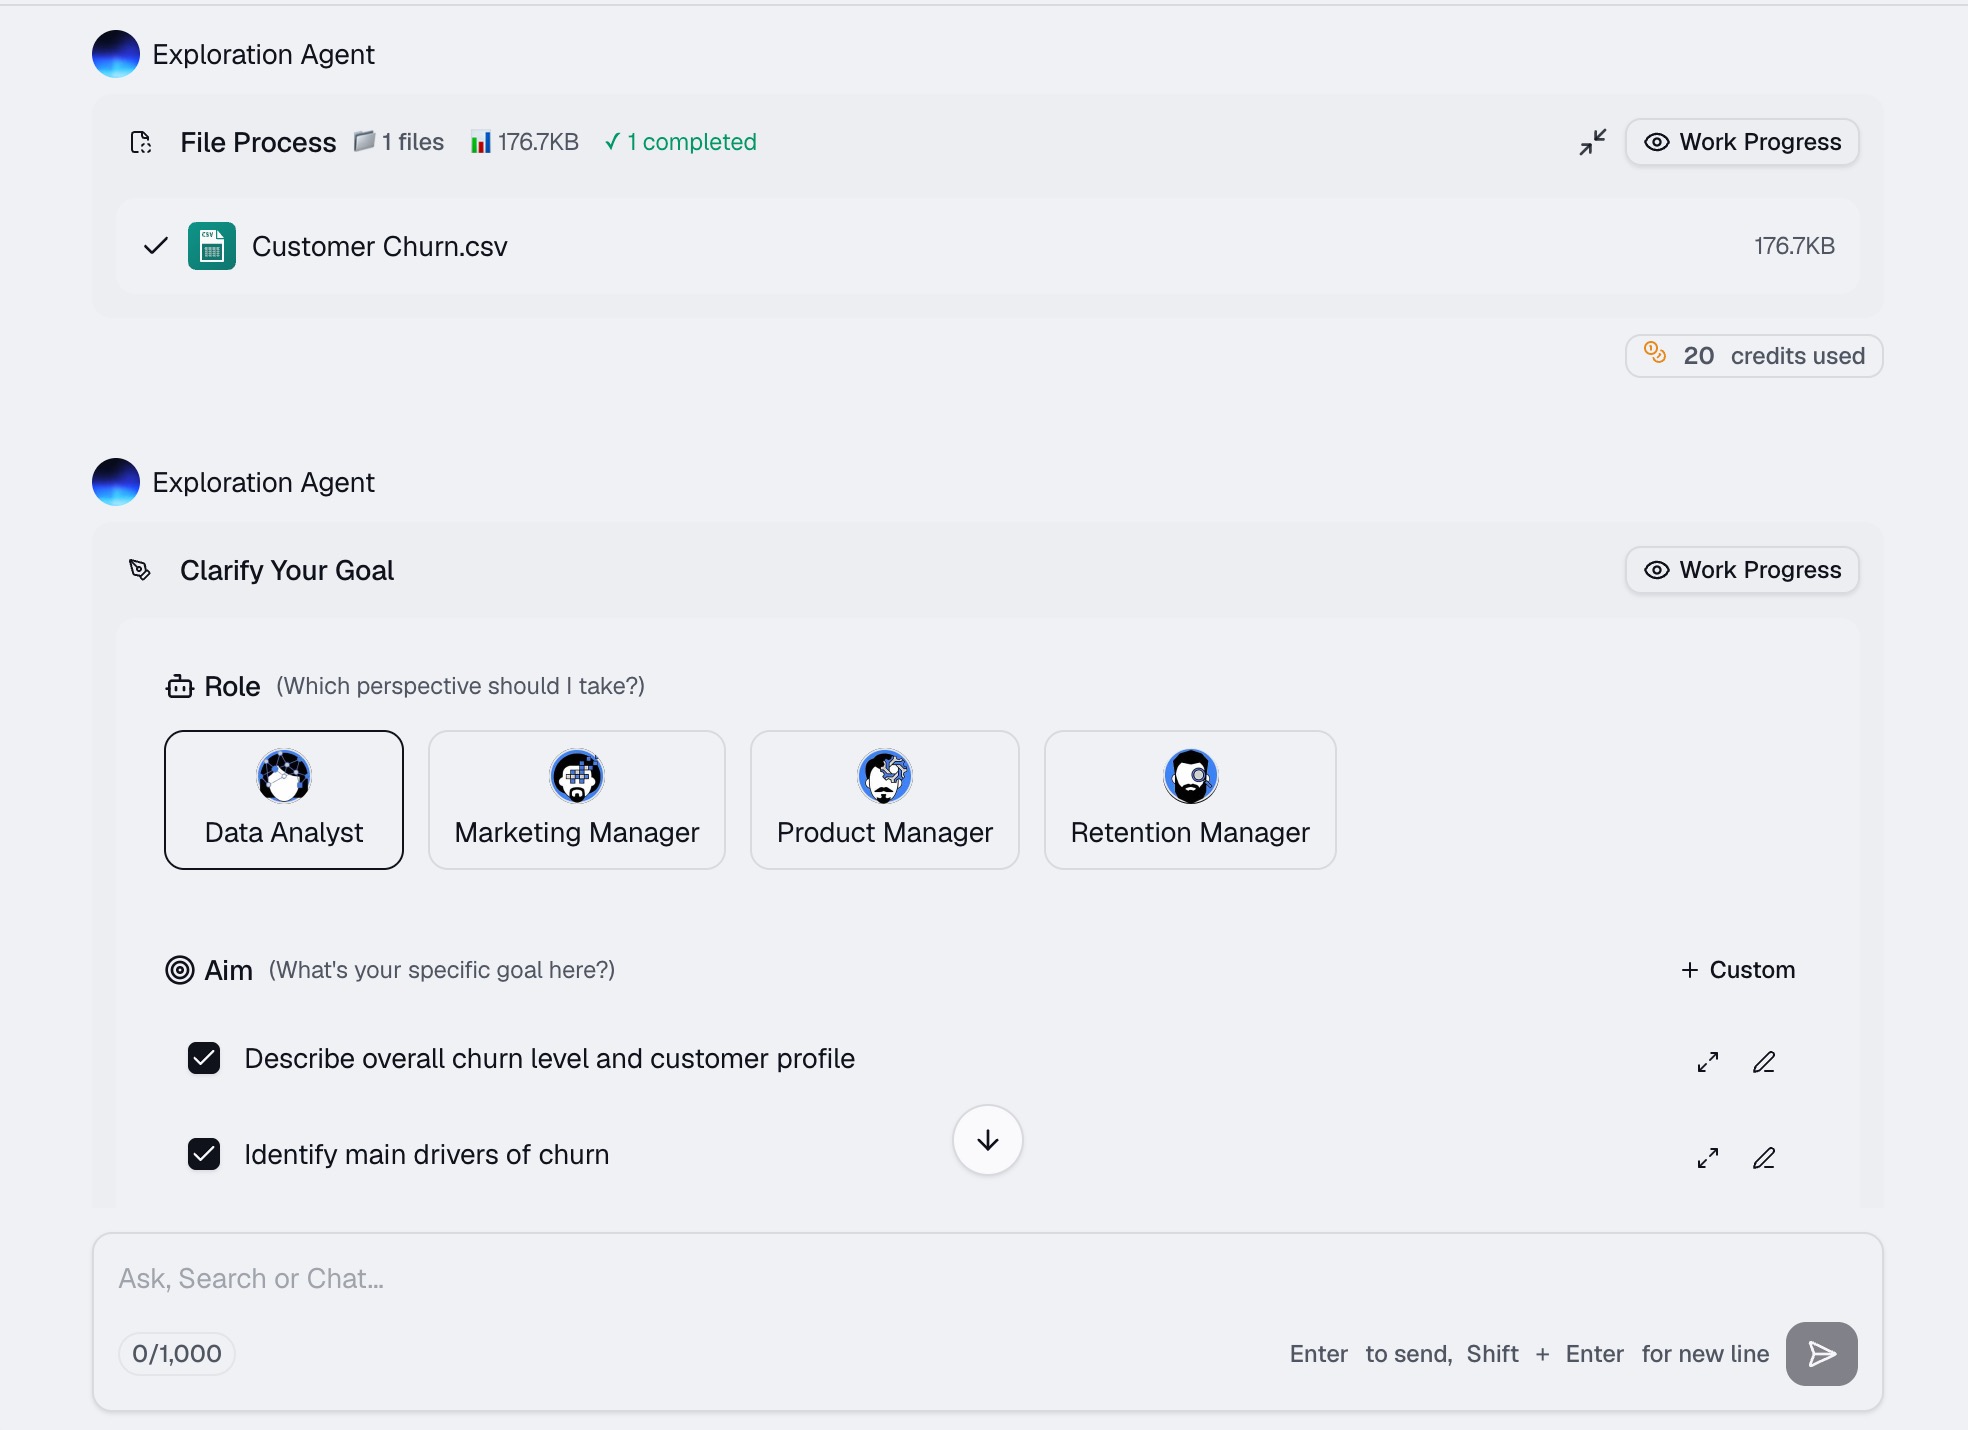
In modern AI tools, clarifying your goal is as simple as typing a question in plain English. For example, you might type: "What is the overall churn rate by subscription tier for the last 6 months?" or "Identify the average user lifespan before cancellation." Setting these parameters guides the AI to focus on the exact columns and rows that matter most to your current business objectives.
Step 3: Visualize Customer Churn Trends
Reading rows of numbers in a spreadsheet can make your eyes glaze over. Visualization is the key to making data digestible and actionable. Once you have asked your questions, the next step is to generate visual representations of your churn data.
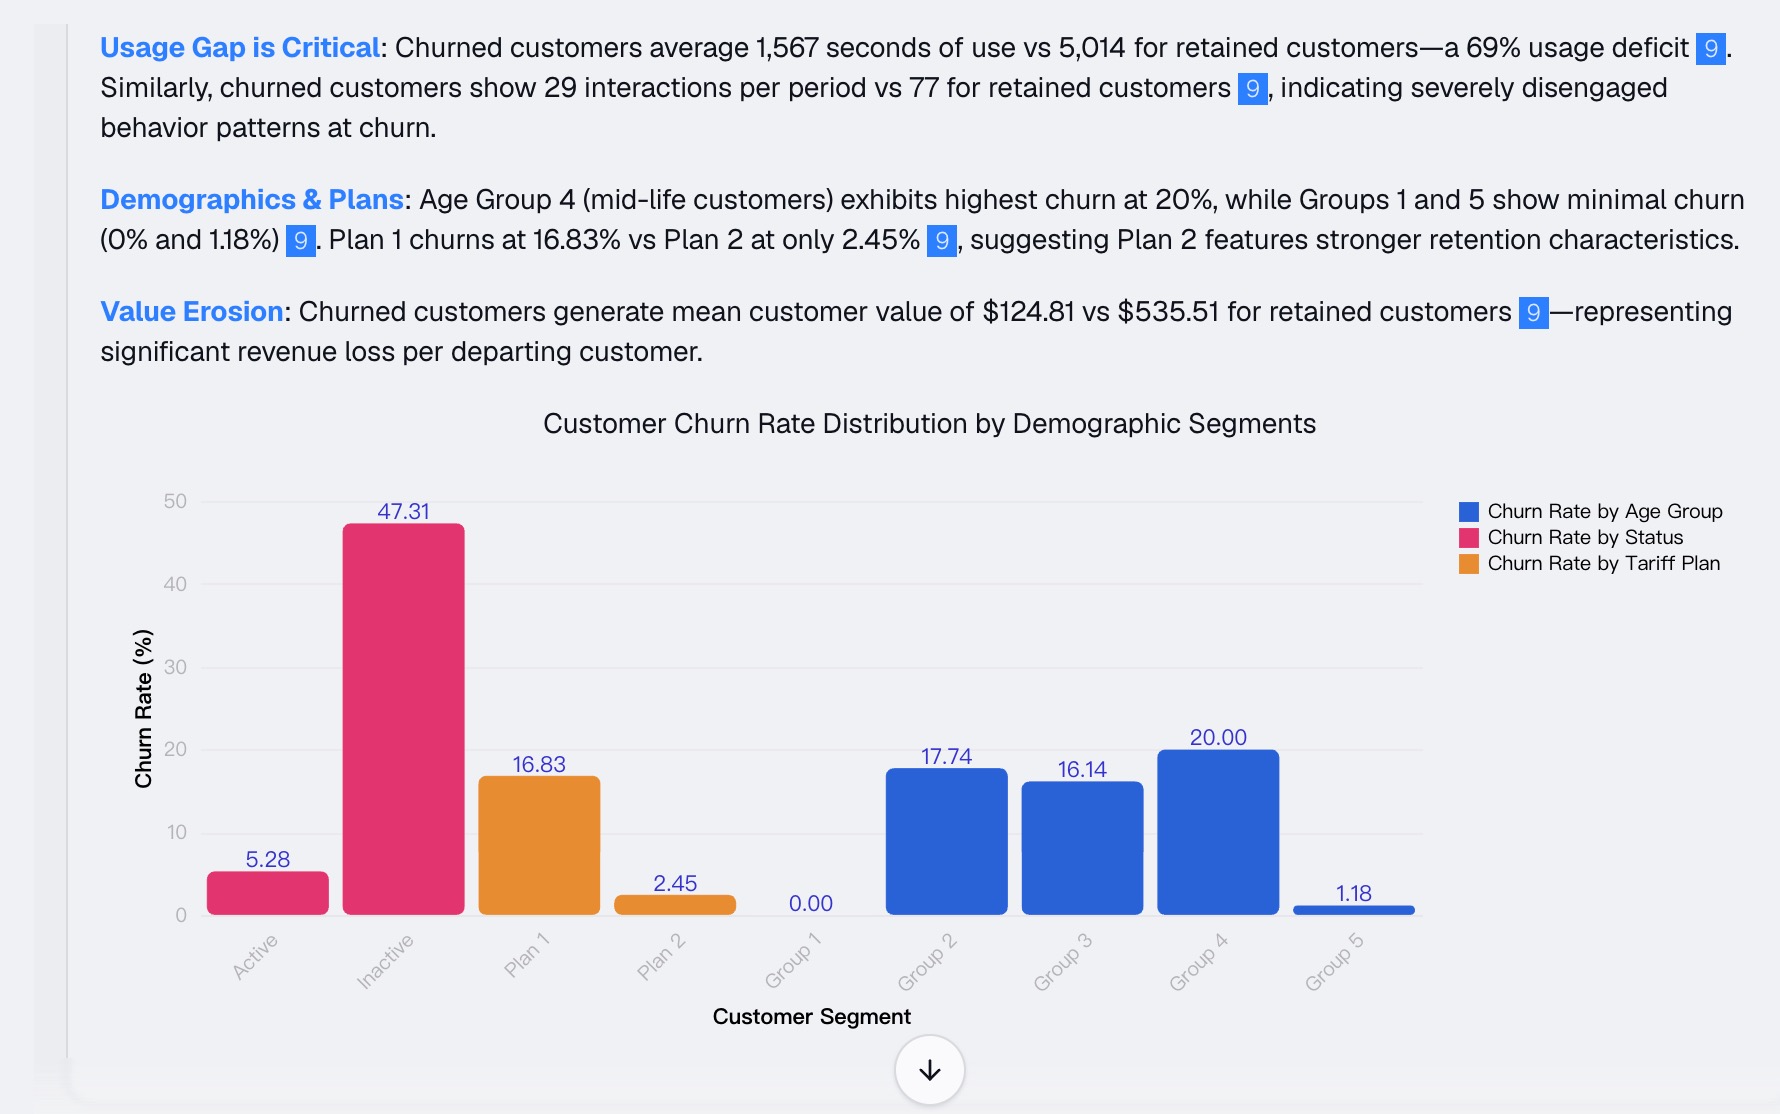
For timeline-based analysis, line charts are incredibly effective. You can generate a line graph showing the number of cancellations month-over-month to spot seasonal trends. Bar charts are perfect for comparing churn rates across different pricing plans or demographics. Pie charts can quickly summarize the reasons for cancellation (if you collect that data via exit surveys). Creating these visualizations helps you immediately spot anomalies—like a sudden spike in cancellations right after a recent product update.
Step 4: Generate AI-Powered Churn Insights
The final and most powerful step is moving from simple reporting to true, AI-driven insights. While a chart tells you what happened, AI can help explain why it happened and what to do next.
By clicking on the "Generate Insights" feature in your tool, the AI will scan the entire CSV to find hidden correlations that you might have missed. It might generate a narrative summary that says: "Customers on the Basic Plan who log in less than twice a month have an 80% higher probability of churning within the first 90 days." Armed with these automated, deep-dive insights, your team can immediately launch targeted re-engagement email campaigns specifically for low-activity Basic Plan users.
How Powerdrill Bloom Simplifies Customer Churn Analysis
If the process of sorting through spreadsheets, writing complex formulas, and manually building pivot tables sounds exhausting, you are not alone. This is exactly where Powerdrill Bloom steps in to revolutionize how businesses handle their data. Powerdrill Bloom simplifies customer churn analysis in several key ways:
Zero-Code Natural Language Querying: You don't need to know Python, SQL, or complex Excel macros. With Powerdrill Bloom, you simply chat with your CSV file. You can type questions like, "Which demographic had the highest churn rate in August?" and the platform will instantly provide the answer.
Instant, Automated Visualizations: Forget spending hours formatting charts. Powerdrill Bloom automatically selects the best visual format (bar, line, scatter plot) based on the context of your data, allowing you to build a professional-grade churn dashboard in seconds.
Smart Anomaly Detection: The AI engine proactively scans your CSV for unusual patterns. If there is an unexpected spike in customer cancellations from a specific cohort, Powerdrill Bloom will automatically highlight this anomaly so you can address it before it impacts your bottom line.
Actionable Business Recommendations: Powerdrill Bloom doesn't just act as a calculator; it acts as a data scientist. Based on the trends in your CSV, it offers strategic suggestions, helping you build targeted customer success interventions based on concrete evidence.
Common Customer Churn Analysis Use Cases
Customer churn affects almost every industry, but the way it is analyzed can vary based on the business model. Here are some of the most common use cases for churn analysis using CSV data:
SaaS (Software as a Service) Companies: For subscription-based software, tracking MRR (Monthly Recurring Revenue) churn is vital. SaaS companies analyze CSV data to find out if users are dropping off after their free trial ends, or if long-term users are leaving due to a lack of new features.
E-commerce and Retail: E-commerce businesses don't have traditional "cancellations," so they measure churn by analyzing repeat purchase rates. They use CSV files containing order histories to identify customers who haven't made a purchase in 6 or 12 months, triggering automated discount emails to win them back.
Telecommunications and Utilities: Mobile network providers and internet service providers use churn analysis to track users nearing the end of their contracts. By analyzing data on network usage, dropped calls, and customer service complaints, they can offer personalized upgrade deals to prevent users from switching to competitors.
Subscription Box Services: Physical subscription services (like meal kits or beauty boxes) analyze CSVs to see how factors like delivery delays, geographical location, or seasonal changes affect subscriber retention, allowing them to optimize their logistics and marketing.
Conclusion
Understanding customer churn is no longer an option; it is an absolute necessity for sustainable business growth. By taking the simple step of exporting your customer data into a CSV file, you open the door to a wealth of strategic insights. You can uncover hidden trends, understand the exact reasons why your customers are leaving, and build data-backed strategies to keep them engaged.
However, you shouldn't have to spend hours wrestling with manual spreadsheets to get these answers. If you are ready to transform your raw data into clear, actionable retention strategies effortlessly, it is time to upgrade your toolkit. Try Powerdrill Bloom today to chat with your data, instantly generate stunning visualizations, and let AI reveal the insights you need to stop churn in its tracks and accelerate your business growth.
FAQs
What is a good churn rate?
A good churn rate depends on your industry, but generally, an annual churn rate of 5% to 7% is acceptable.
Can I use Excel for churn analysis?
Yes, but Excel lacks automated AI insights and advanced visualizations, making tools like Powerdrill Bloom a much faster alternative.
What data should my CSV include?
Include unique customer IDs, sign-up dates, churn status, subscription tiers, demographic details, and total revenue per user.
How often should I analyze churn?
It is recommended to analyze your customer churn monthly to quickly identify negative trends and implement timely retention strategies.
Is Powerdrill Bloom safe for customer data?
Absolutely. Powerdrill Bloom prioritizes data privacy and employs enterprise-grade encryption to ensure your uploaded CSV files remain completely secure.