How to Generate Infographics with AI: 3 Tools + Guide

Introduction
In today’s attention economy, no one reads walls of text. Infographics are the undisputed kings of content strategy, capable of simplifying complex reality into digestible visuals. But traditionally, creating them has been a bottleneck: expensive designers, complex software, and hours of tweaking pixels.
You are likely searching for ai infographic generator or data to infographic ai because you want a solution, not another chore. You want automation.
The good news? AI has evolved. It’s no longer just about "assisting" design; it’s about generating intelligence.
What is an AI Infographic Generator?
An AI Infographic Generator is a tool that leverages artificial intelligence to automatically convert text, prompts, or raw datasets into visually structured charts and graphics.
These tools bridge the gap between "Analytic Left Brain" (Data) and "Creative Right Brain" (Design). They allow marketers, business analysts, and content creators to produce professional assets without ever touching Adobe Illustrator.
Key Features to Look For
To truly solve your pain points, the best ai for infographics must go beyond basic templates. Look for these three pillars:
Data Processing Power: Can it read your Excel files directly?
True Automation (Agentic Workflow): Does it require you to drag-and-drop elements, or does it "One-Click" the entire process?
Aesthetic Quality: Is the output professional and "fancy" enough for a business presentation?
Top 3 AI Tools for Infographics in 2025
Based on automation capabilities and output quality, here are the top contenders.
1. Powerdrill Bloom
If you want to turn data into visual storytelling instantly, Powerdrill Bloom is the category leader for 2025.
Powerdrill Bloom positions itself as an AI Agent proficient in industry knowledge across various fields. It excels because it integrates data analysis with high-end visualization capabilities powered by Nano Banana Pro.
Why Powerdrill Bloom:
Versatile Input: Whether you upload a complex Excel spreadsheet or just type a simple topic (e.g., "Global EV Sales Trends"), Bloom handles it.
Agent Core: It acts as a data analyst. It first understands your data/topic to generate meaningful insights, then visualizes them.
Nano Banana Pro Integration: This is the secret sauce. Embedded within Bloom, Nano Banana Pro instantly transforms dry numbers into visually stunning infographics or PPT slides.
Speed: From raw data to a finished, fancy chart in seconds to minutes.
Zero Threshold: No code. No design skills needed. It is pure automation.
2. Canva
Canva remains a household name. Its "Magic Design" features are improving.
Pros: Massive template library and intuitive interface for minor edits.
Cons: It is still primarily a design tool. Visualizing complex data requires significant manual effort compared to Bloom’s automated insight generation.
3. Visme
Visme is a strong contender for corporate communications.
Pros: Good for interactive charts and long-form reports.
Cons: steeper learning curve than Bloom. It often feels like a traditional editor with AI features bolted on, rather than an AI-native agent.
Step-by-Step Guide: Generating Infographics with Powerdrill Bloom
Forget complex tutorials. Powerdrill Bloom is designed for instant gratification. Here is how to create a professional infographic in under a minute:
Step 1: Access the Agent
Log in to Powerdrill Bloom. You are greeted by a chat-based interface—simple and focused.
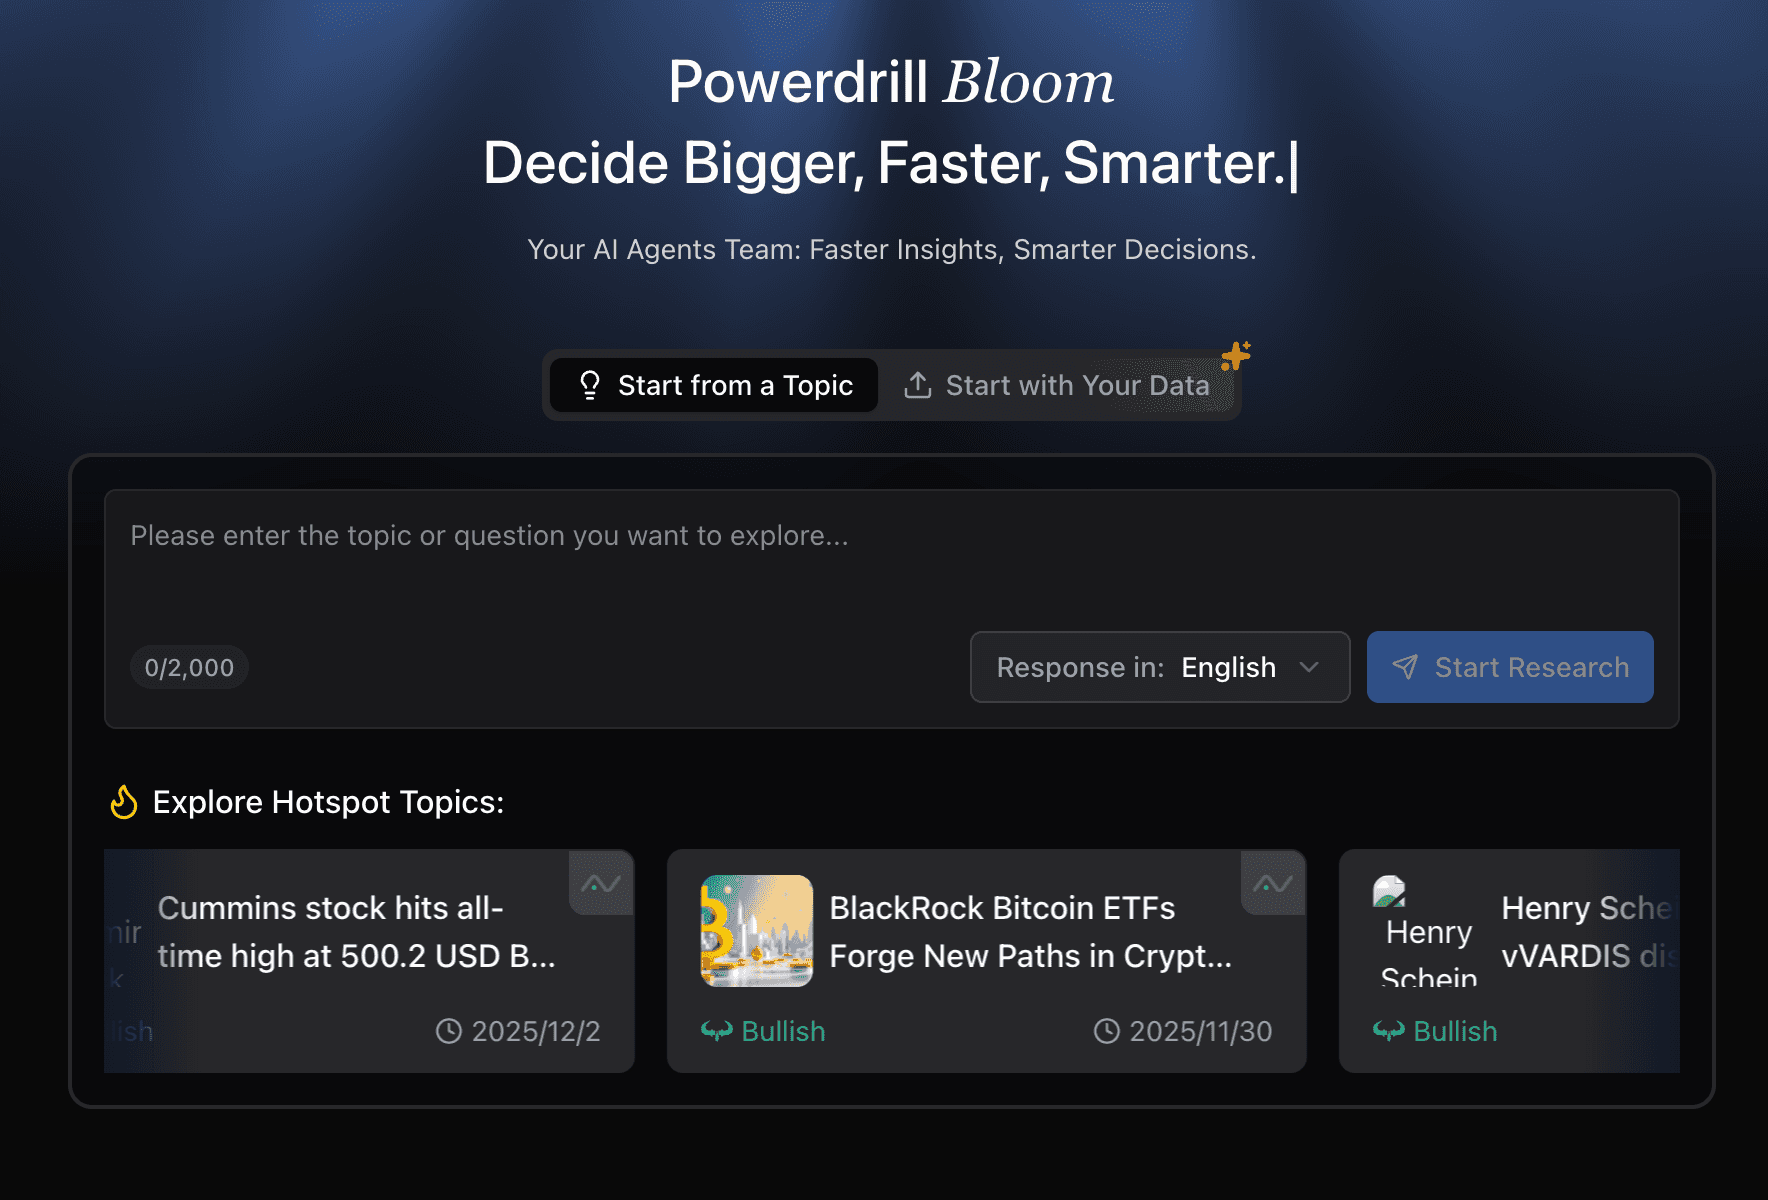
Step 2: Input Your Data or Idea
Option A (Data Driven): Upload your Excel/CSV file directly.
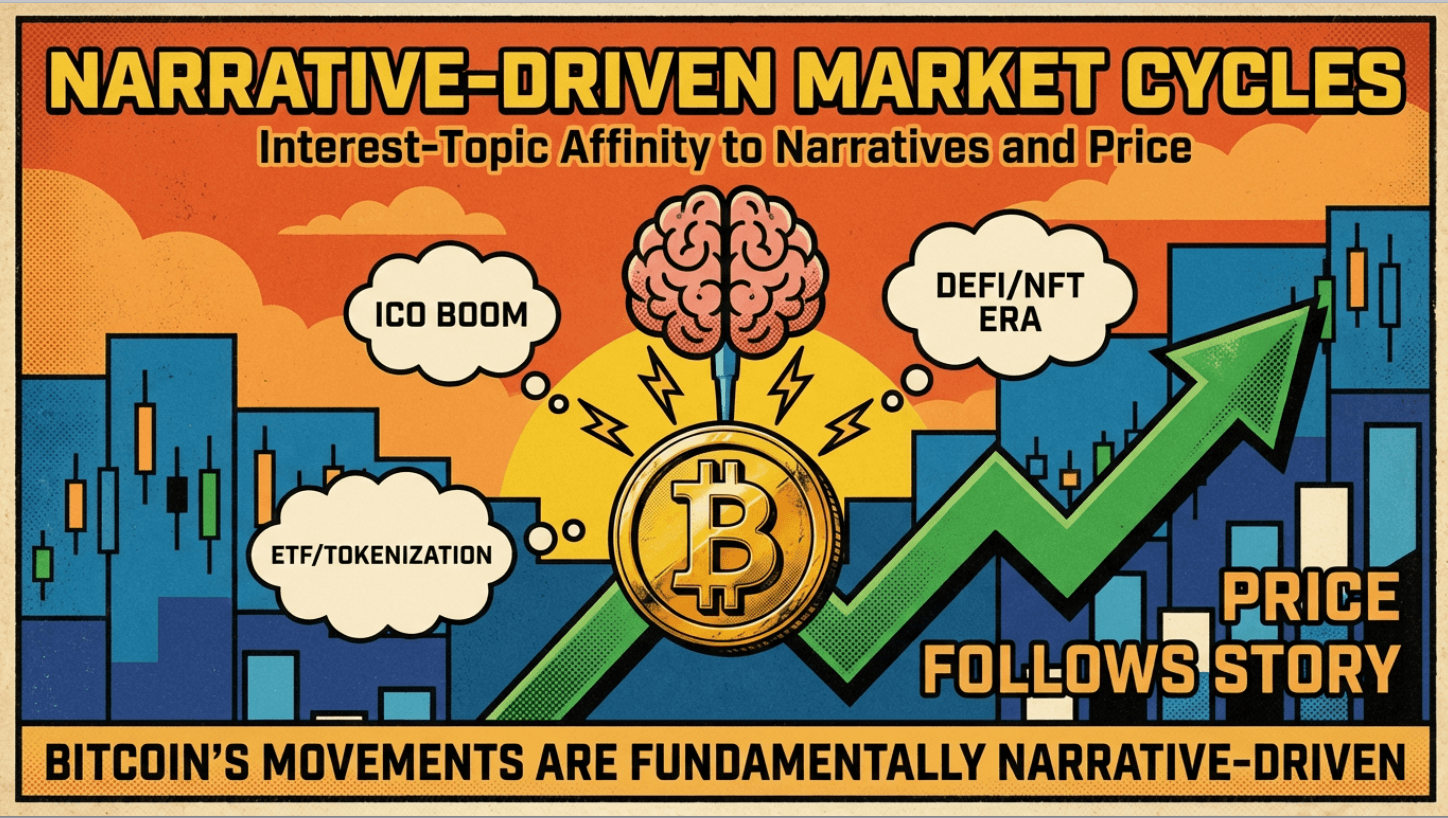
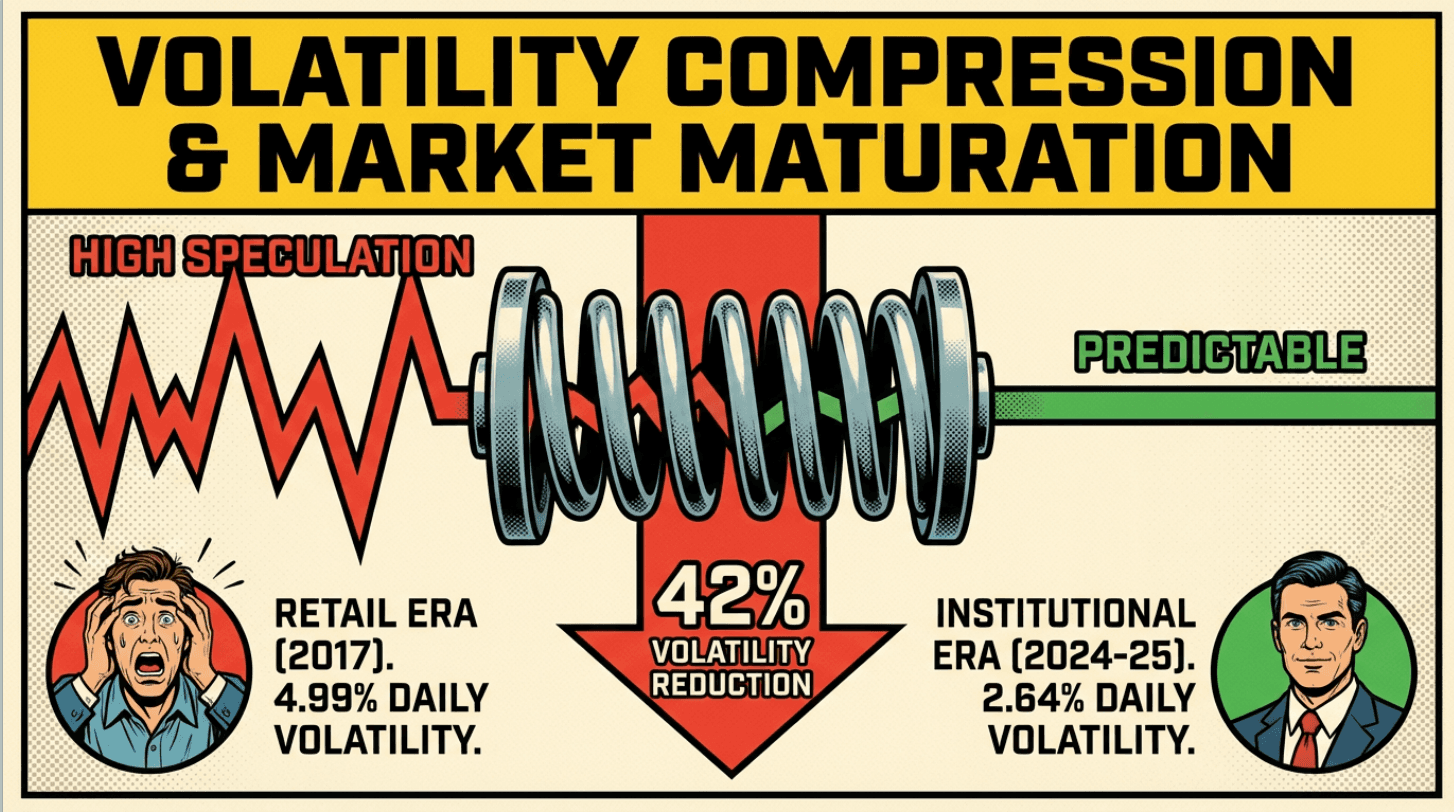
Option B (Topic Driven): Simply type a prompt like, "Analyze the trend of Bitcoin history data"
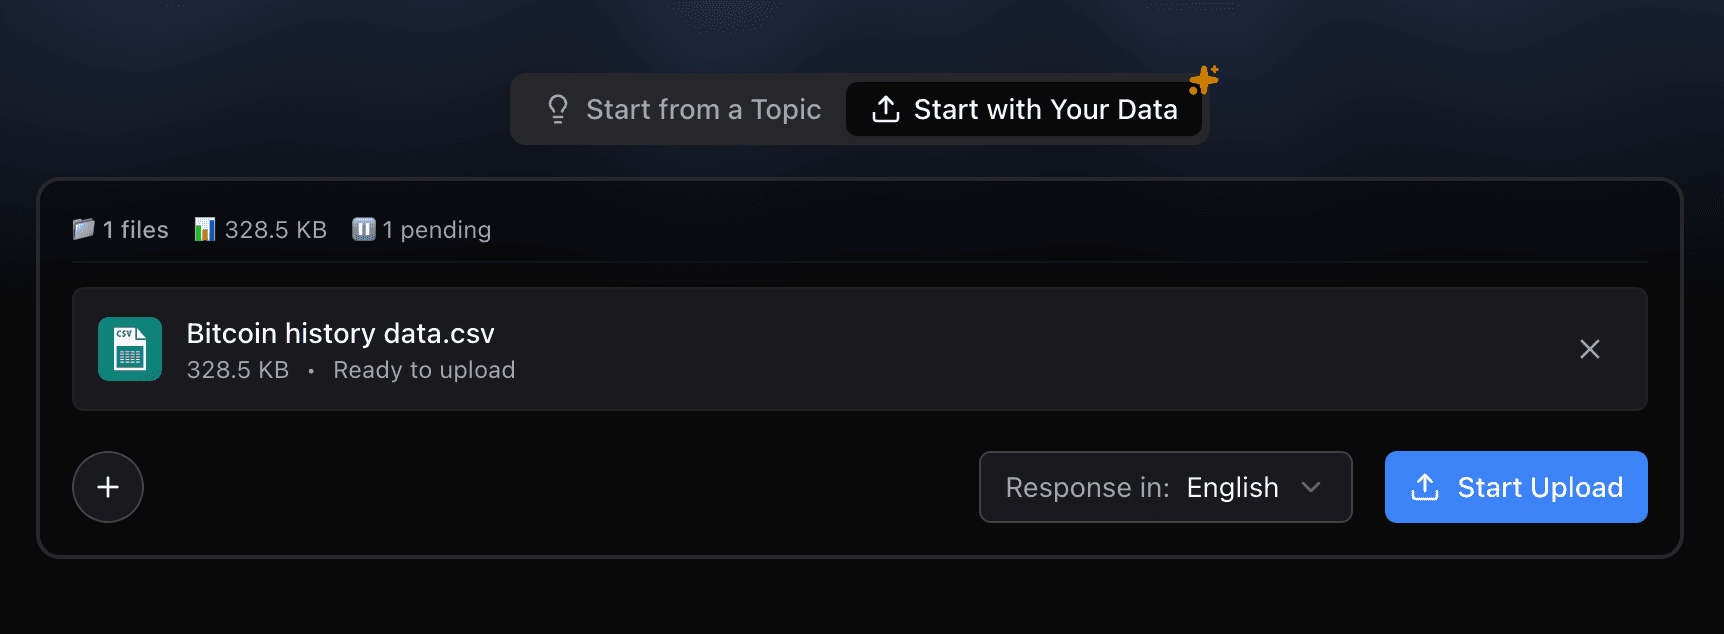
Step 3: Watch the Magic Happen
The Agent analyzes the input. If it's a file, it cleans the data and identifies trends. If it's a topic, it gathers relevant structure.
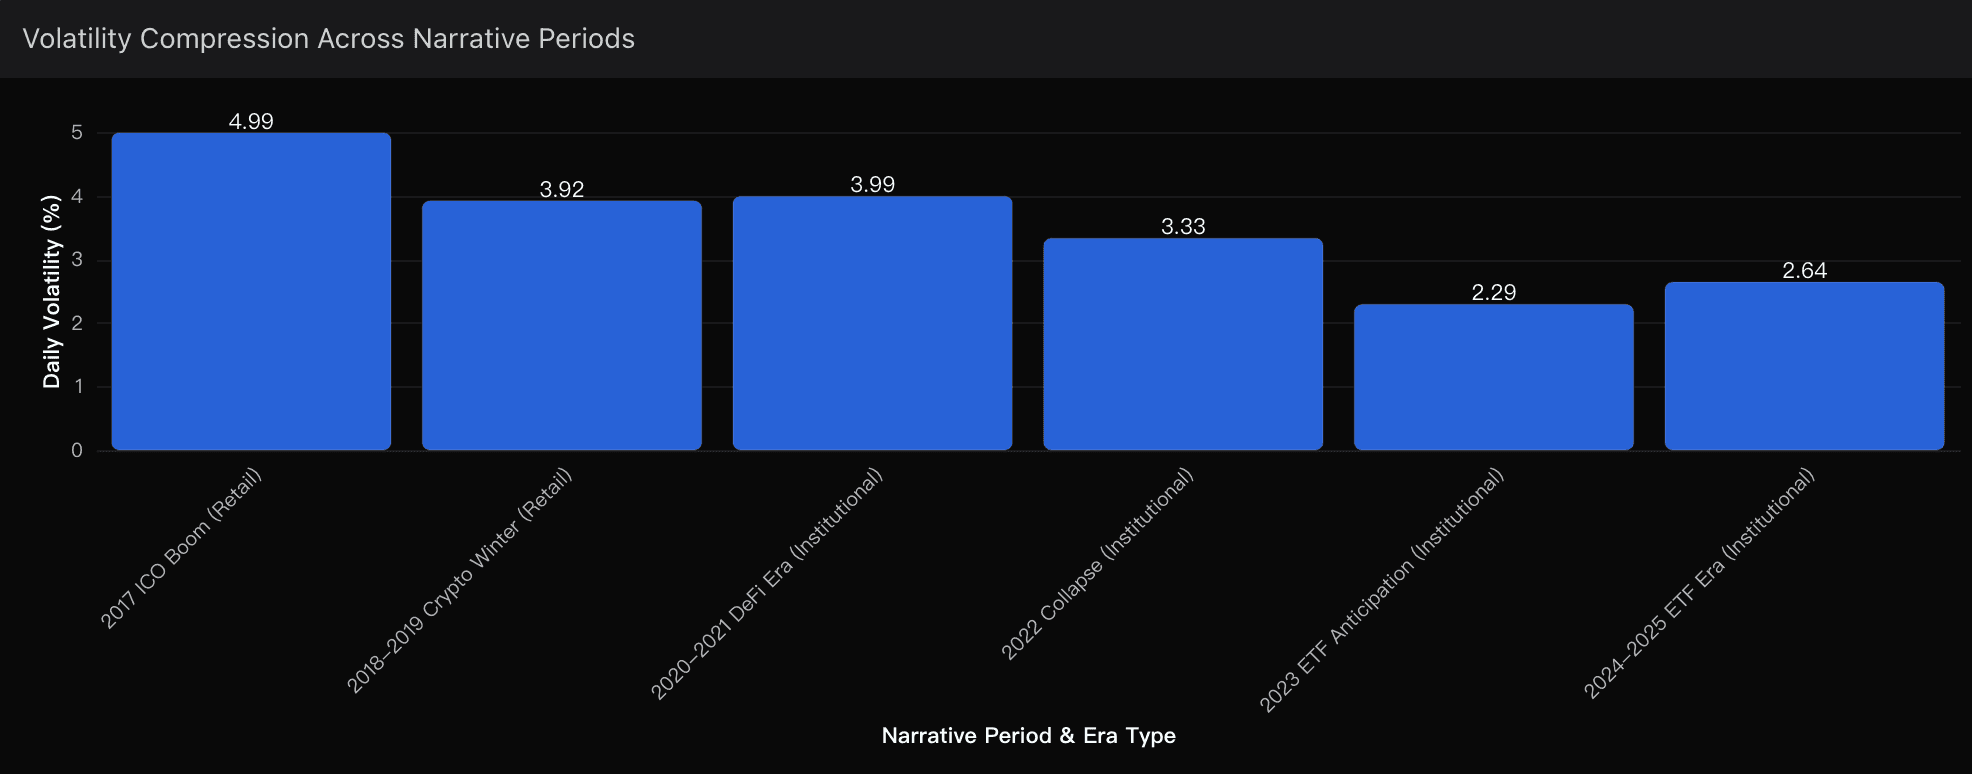
Step 4: Visualize with Nano Banana Pro
Powerdrill Bloom triggers the Nano Banana Pro engine to render the insights. In seconds, you get generated Bar charts, Pie charts, or Trend lines that are aesthetically polished.
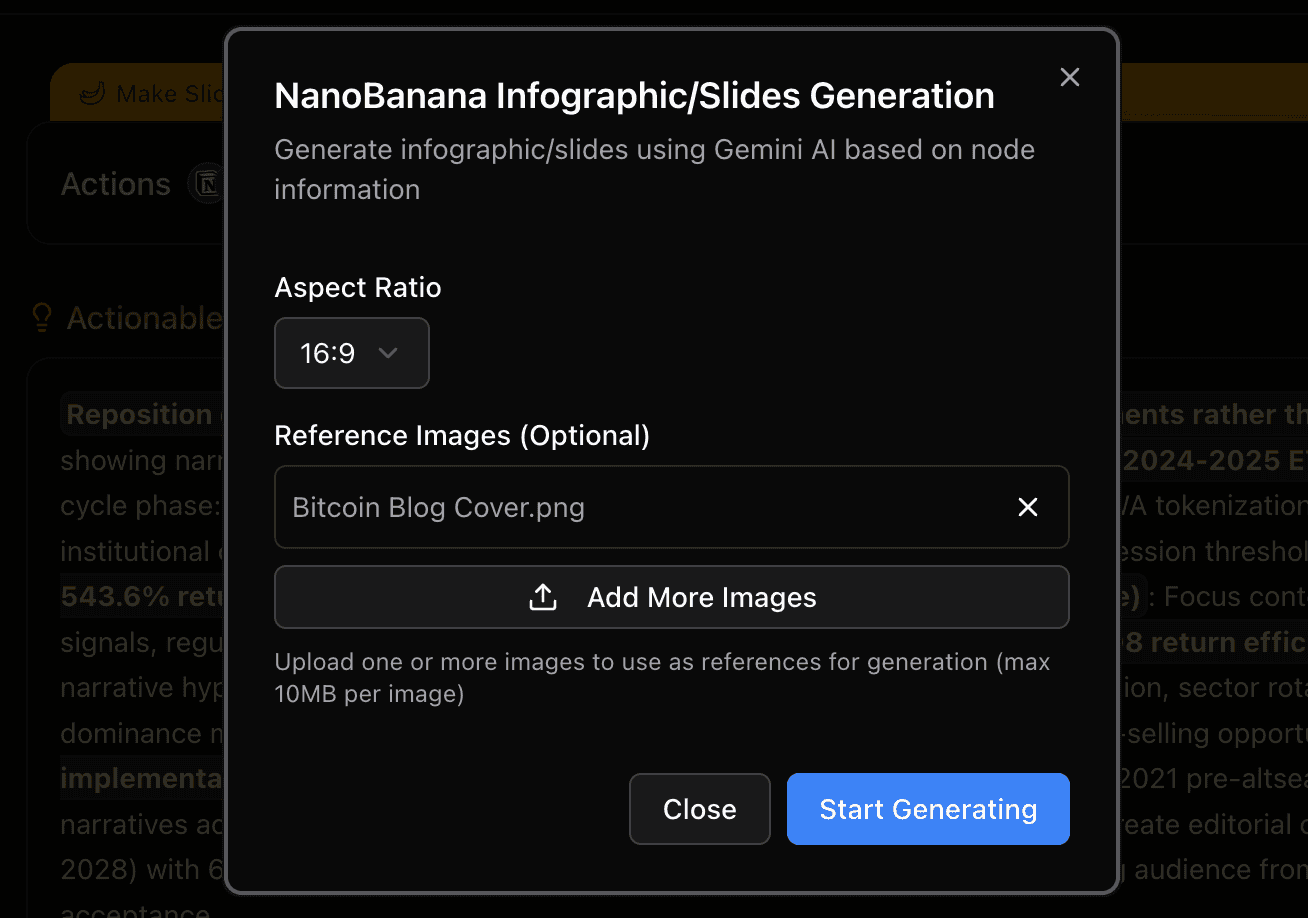
Step 5: Export
Download your visual as a high-quality image or a PPT slide, ready for your presentation.
Conclusion
Stop wasting hours adjusting column widths and picking colors. The future of content creation is Agentic.
While tools like Canva offer great templates, Powerdrill Bloom stands alone as the best solution for users who need to bridge the gap between Raw Data and Professional Visuals instantly. By leveraging its intelligent agent core and the visual power of Nano Banana Pro, you can turn a spreadsheet into a compelling story in seconds.
Ready to transform your workflow? Try Powerdrill Bloom today and let the AI be your data analyst and designer rolled into one.