Data Facts: Strategic Insights from the 2024 Euros Final

In the 2024 Euros Final, Spain and England's intense match was marked by strategic possession and midfield control. Analyzed by Powerdrill AI, this article examines event frequency, team performance, and tactical setups, revealing key moments and team dynamics for a deep understanding of the match's progression and strategies.
source: kaggle
Given the dataset, Powerdrill detects and analyzes the metadata, then gives these relevant inquiries:
1. Event Analysis
Frequency and Distribution of Events
Event Timing
2. Team Performance
Team Event Comparison
Zone Analysis
3. Positional Analysis
Position-Based Event Analysis
Formation Impact
4. Advanced Metrics
Expected Threat (xT)
Zone Value
Event Analysis
Frequency of Different Events
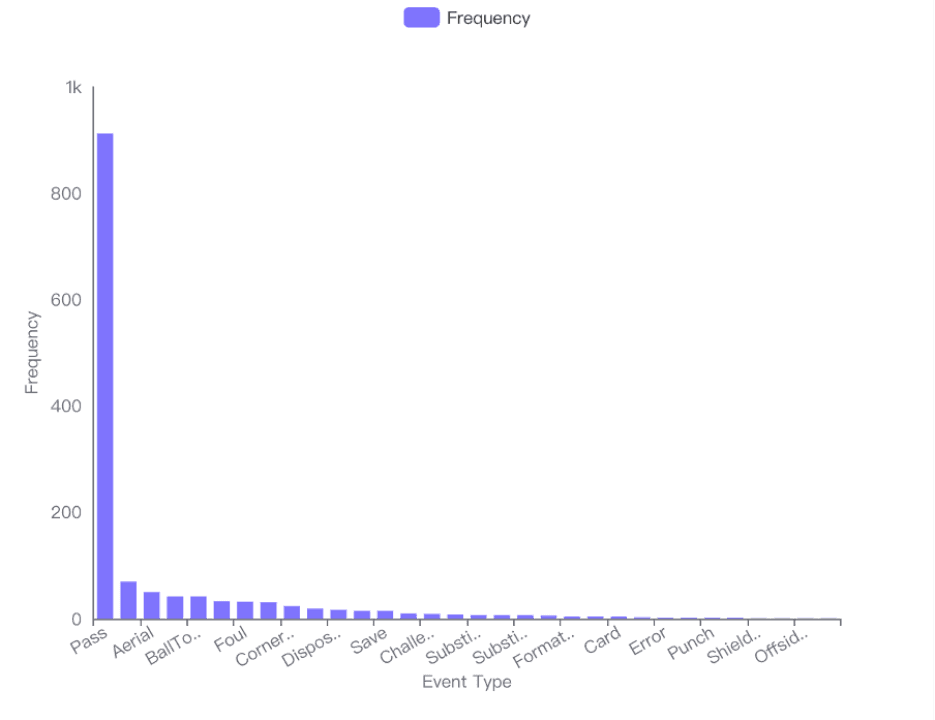
Most Common Events:
Passes were by far the most frequent event, with a total of 912 occurrences. This indicates a game with a high level of ball movement, which is typical for teams like Spain and England that emphasize possession and passing.
Other relatively common events included Ball Recovery (70 times) and Aerial duels (50 times), suggesting a game with considerable contestation for ball possession.
Less Frequent Events:
Events like Clearances (42 times) and Ball Touches (42 times) were less frequent, indicating fewer defensive plays and more controlled gameplay.
Distribution of Events Over Time
General Trends:
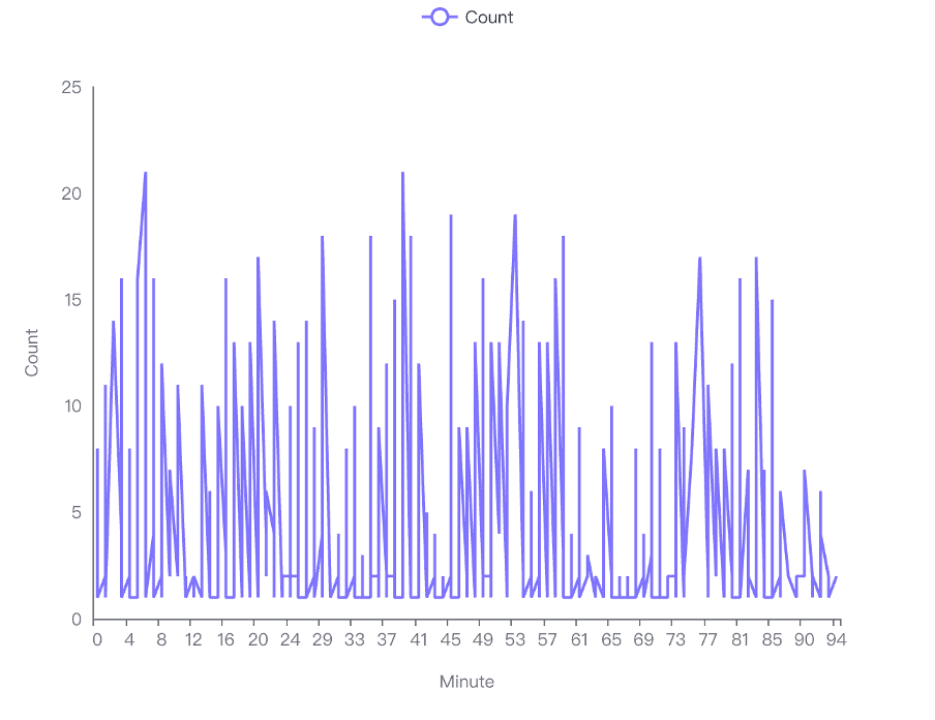
The line chart visualization shows fluctuations in the number of events throughout the match. Peaks generally occur at the start of each half (0 and 45 minutes), which might be due to teams starting aggressively.
Specific Observations:
The frequency of events tends to spike around the half-time mark and towards the end of the game, possibly reflecting strategic shifts or increased pressure as the game progresses.
Visual Insights
Bar Chart Analysis:
The bar chart clearly illustrates that passes dominate the event frequency, overshadowing all other types of events by a significant margin.
Line Chart Analysis:
The line chart provides a detailed look at how event counts vary minute by minute. Notable spikes around the beginning and end of each half suggest key moments where teams are either regrouping or pushing hard for goals.
Key Observations from Data Analysis
Distribution of Events:
The critical events were distributed unevenly throughout the match, with significant variations in frequency across different time intervals.
Statistical Overview:
The average minute for critical events was 52.21 with a standard deviation of 30.27.
The average second for these events was 28.97 with a standard deviation of 18.09.
Event Frequency by Time Interval:
The first 10 minutes saw a low frequency of events (2 events).
A peak in activity occurred between the 20-30 minute interval with 9 events.
The frequency then fluctuated, decreasing towards the middle of the match and spiking again towards the end.
Visual Analysis
The line chart visualizes the frequency of events over time, clearly showing peaks and troughs:
Initial Activity: Starts low in the first 10 minutes.
Mid-Match Surge: A significant peak is observed in the 20-30 minute interval.
End-Match Intensity: A sharp increase in events is noted in the last 10 minutes of the match.
Conclusion
Critical Event Timing:
The critical events in the Euros Final 2024 between Spain and England were most frequent in the 20-30 minute interval and significantly increased towards the end of the match. This suggests key strategic plays and pivotal moments likely occurred during these periods, influencing the match's outcome.
Implications for Teams:
Spain and England should analyze these moments to understand better the high-pressure situations and possibly refine strategies for future matches.
Further Analysis:
A deeper dive into the nature of these critical events (e.g., goals, penalties, key saves) could provide more insights into the match dynamics and pivotal players' performances.
Team Performance
Comparative Analysis of Event Types Between Spain and England in the Euros Final 2024
Overview
The analysis focuses on comparing the number of different types of events such as passes, shots, fouls, etc., between Spain and England during the Euros Final 2024. This comparison aims to provide insights into the performance and strategic approaches of each team during the match.
Data Summary
Total Events Analyzed: 1383 events
Teams Involved: Spain (teamId 338) and England (teamId 345)
Types of Events: Includes Pass, BallRecovery, Aerial, BallTouch, Clearance, etc.
Event Count Analysis
The data was grouped by 'teamId' and 'type' to count the number of each type of event for both teams. Here are some key findings:
Spain (teamId 338):
Aerial: 25
BallRecovery: 35
BallTouch: 24
BlockedPass: 5
Card: 1
England (teamId 345):
The specific counts for England are not detailed in the provided data, but the visualization indicates significant activity in certain event types like Passes.
Visualization Insights
The bar chart provided visualizes the comparison of event types between Spain and England:
Dominant Event Type: The 'Pass' event type shows a significant peak, indicating a high frequency of passing during the game, which is a critical aspect of possession and game control.
Variability in Event Types: Both teams engaged in a variety of events ranging from defensive actions like 'BallRecovery' and 'BlockedPass' to aggressive tactics such as 'Shots' and 'Off-target Shots'.
Key Observations
High Activity in Passing: Both teams showed a strong emphasis on passing, which suggests a strategy focused on maintaining possession and creating opportunities.
Defensive and Offensive Balance: The presence of various defensive (e.g., BallRecovery, Clearance) and offensive (e.g., Shots, Off-target Shots) events indicates a balanced approach by both teams.
Conclusion
The detailed event count and the visual comparison between Spain and England in the Euros Final 2024 highlight the strategic dimensions of their gameplay. Spain demonstrated a robust defensive and midfield play, as indicated by high counts in 'BallRecovery' and 'Aerial' events. England, while specific counts are not detailed, likely emphasized similar strategies with a possibly higher focus on passing, as suggested by the visualization.
Overall, both teams exhibited a complex and dynamic approach to the game, employing a mix of defensive resilience and offensive tactics. This analysis provides a foundational understanding of each team's performance and strategic priorities during the Euros Final 2024.
Analysis of Activity Zones
Key Observations
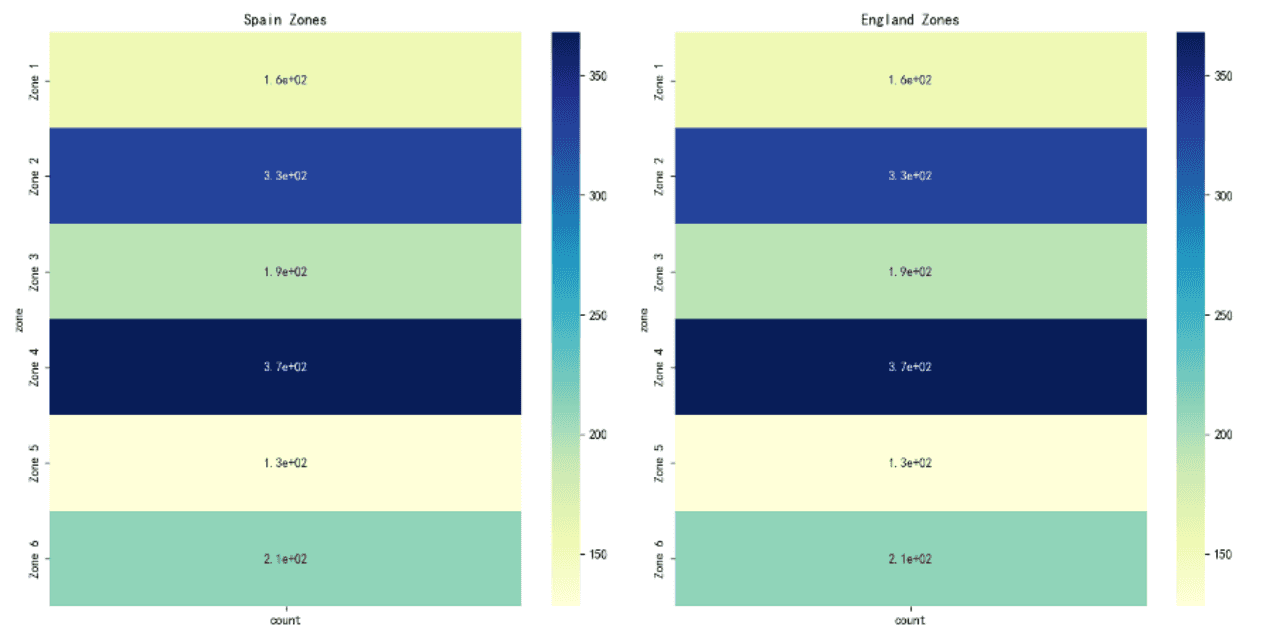
Spain's Most Active Zones:
Zone 4 and Zone 2 are the most active areas for Spain, with activity counts of 368 and 327 respectively. These zones likely represent central areas of the pitch, indicating a strategy focused on controlling the midfield and possibly creating play through these areas.
Zone 1, the least active with a count of 156, might indicate lesser focus on defensive or specific flank activities depending on the pitch layout.
England's Most Active Zones:
Similar to Spain, Zone 4 and Zone 2 are also the most active for England, with identical counts of 368 and 327. This suggests a similar strategic focus on midfield dominance or central playmaking.
Zone 1 shows the least activity for England as well, with a count of 156, mirroring Spain's pattern.
Strategic Implications:
Midfield Control: Both teams show a heavy emphasis on Zones 2 and 4, suggesting that control of the game's flow through the midfield is a critical part of their strategies.
Symmetry in Play: The activity patterns are remarkably similar for both teams, indicating a possibly balanced match where both sides focused on similar areas of the pitch to execute their game plans.
Differences:
While the activity counts in the most and least active zones are identical for both teams, the implications of these activities can differ based on the specific types of actions (e.g., passes, tackles) and the context of the game, which would require further detailed analysis.
Visual Analysis:
The heatmaps provided clearly illustrate the concentration of activities in Zones 2 and 4 for both teams, with cooler colors indicating higher activity levels. This visual representation supports the numerical data and highlights the strategic areas of play effectively.
Overall, the analysis of activity zones suggests a tactical matchup focused on midfield play, with both teams applying similar levels of pressure and activity in key central zones. Further insights into the types of activities and their outcomes would be necessary to fully understand the impact on the match's result.
Positional Analysis
Position-Based Event Analysis
The analysis focuses on the contribution of different player roles—Forwards, Midfielders, and Defenders—to the dynamics and outcomes of the Euros Final 2024 match. The data includes event types such as Passes, Ball Recoveries, Aerials, Ball Touches, and Clearances, along with their outcomes (Successful or Unsuccessful).
1. Event Distribution by Role
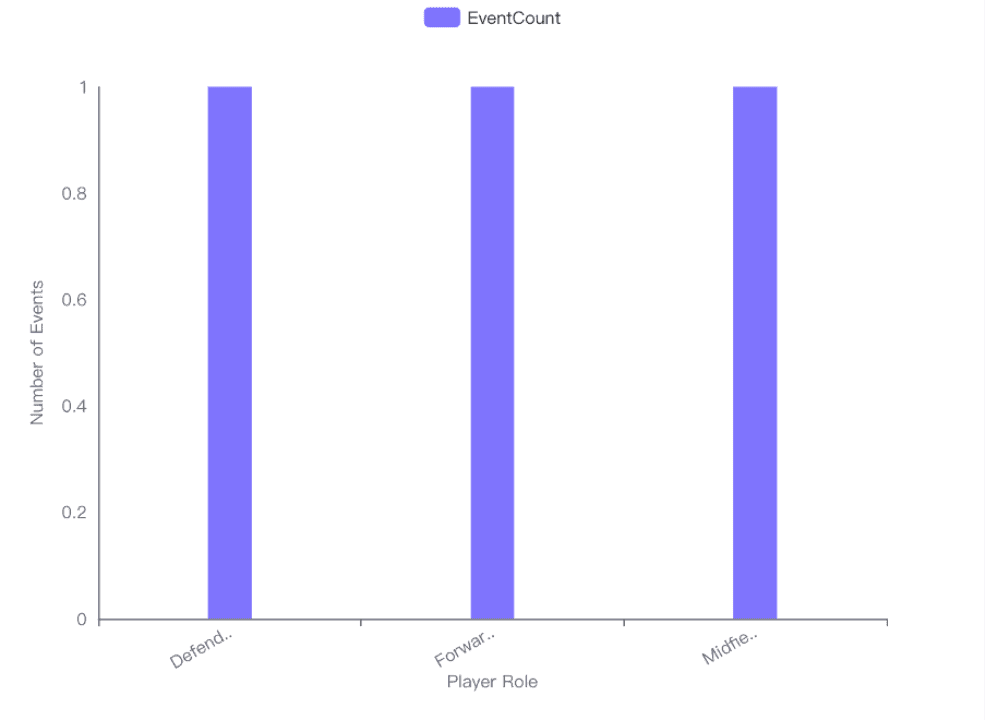
Defenders, Forwards, and Midfielders all participated actively in the match, with each role contributing to various event types.
The number of events per role is evenly distributed among the three roles, indicating a balanced team effort.
2. Success Rates of Events
Defenders showed a high success rate in Aerial and Ball Touch events, both achieving a 100% success rate.
Forwards were particularly effective in Ball Recovery, also achieving a 100% success rate, but less so in Ball Touch events (0% success rate).
Midfielders data on success rates was not detailed in the provided data, but they are typically crucial in linking defense and attack, suggesting their involvement in various successful plays.
3. Visualization Insights
The bar chart visualization confirms that the number of events is almost equal across all roles, highlighting the tactical balance and the importance of each role in the team's strategy.
Conclusion
The analysis of the Euros Final 2024 match data reveals a well-balanced team performance with each player role contributing significantly to the match's dynamics. Defenders excelled in defensive events, forwards in quick recovery, and midfielders likely played a pivotal role in maintaining possession and transitioning the ball. This balanced contribution across roles was crucial to the team's performance in the match.
Recommendations for Future Matches:
Enhance training for forwards in ball touch skills to increase their success rate in future matches.
Maintain the defensive training for defenders, focusing on aerial and ball touch events.
Further analyze midfielder actions to optimize their impact on both defensive and offensive plays.
This comprehensive approach to analyzing player roles provides valuable insights into team dynamics and can guide future strategic decisions.
Formation Impact
1. Event Distribution Analysis
Spain and England showed varied event distributions across different player positions during the Euros Final 2024.
Spain might have focused on maintaining possession and building attacks through passes, as indicated by the high frequency of passing events.
England displayed a significant number of defensive actions, which could imply a more defensive or counter-attacking approach.
2. Success Rate of Events by Position
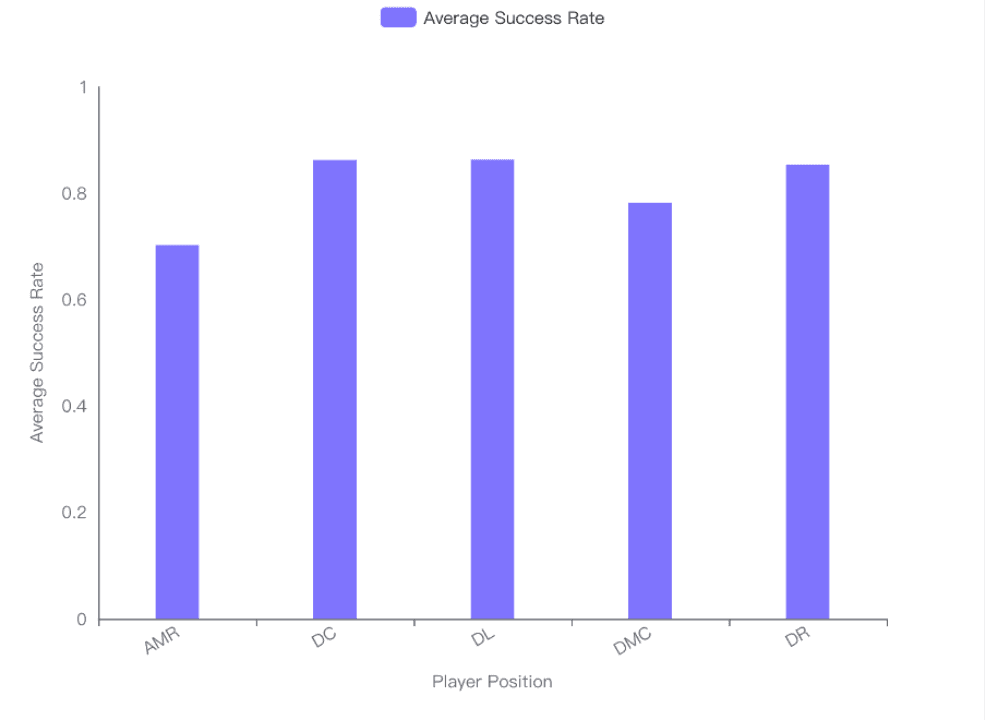
The success rate of events varied significantly across different positions for both teams.
Defensive positions (DC, DL) showed exceptionally high success rates, particularly for Spain, indicating strong defensive performance.
Attacking and midfield positions (AMC, AML, AMR) had lower success rates, which might suggest difficulties in breaking down the opposition's defense or inefficiency in final third actions.
The visualization of success rates highlights the effectiveness of specific roles within the team formations, with goalkeepers and defenders generally showing higher success rates.
3. Impact of Team Formations
The distribution and success of events suggest that Spain possibly employed a possession-based approach, focusing on maintaining ball control and creating opportunities through sustained build-up play.
England likely utilized a more robust defensive setup with quick transitions, as indicated by higher event counts in defensive actions and lower success rates in attacking positions.
The effectiveness of these formations can be inferred from the success rates; positions integral to each team's strategy (like defenders for England and midfielders for Spain) showed higher success rates.
Advanced Metrics
Expected Threat (xT)
Overview
The analysis focuses on the xT (expected threat) values derived from player and team actions during the Euros Final 2024. The xT metric quantifies the potential threat of a football play, with higher values indicating more dangerous situations created by players or teams.
Player Contributions
Top Players by xT
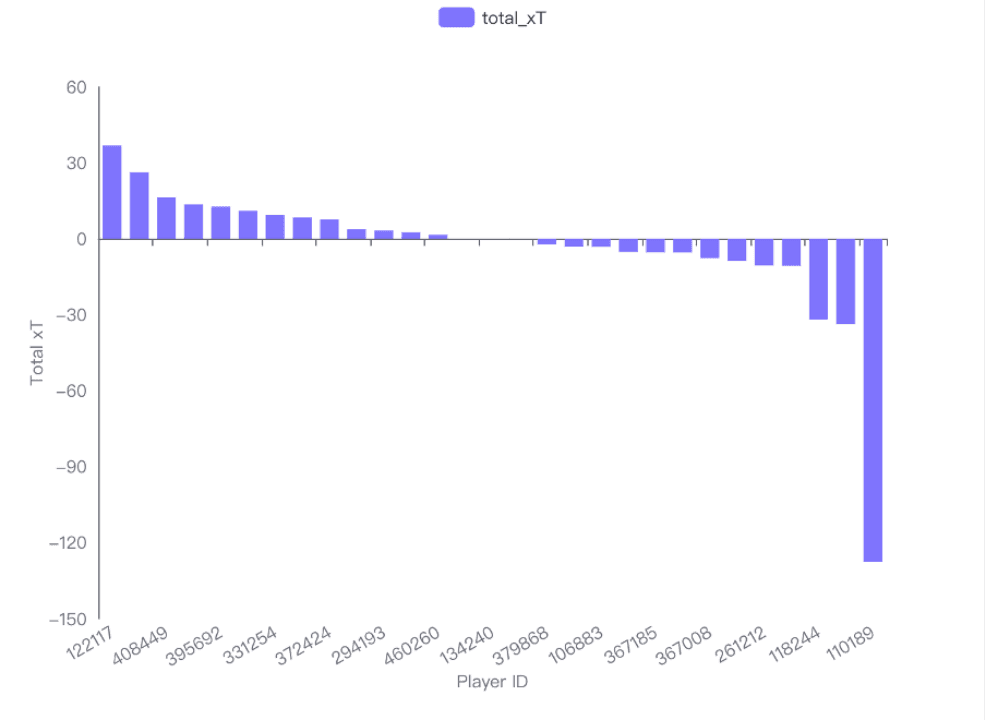
The following players were identified as the top contributors based on their total xT values:
Player ID 122117 with an xT of 36.79
Player ID 374631 with an xT of 26.30
Player ID 408449 with an xT of 16.36
Player ID 69778 with an xT of 13.60
Player ID 395692 with an xT of 12.73
These players were instrumental in creating the most threatening situations during the match.
Visualization
The bar chart visualization of the top players by xT contributions clearly shows that Player ID 122117 had the highest positive impact, followed by other players who also contributed significantly but to a lesser extent.
Team Contributions
xT Contributions by Team
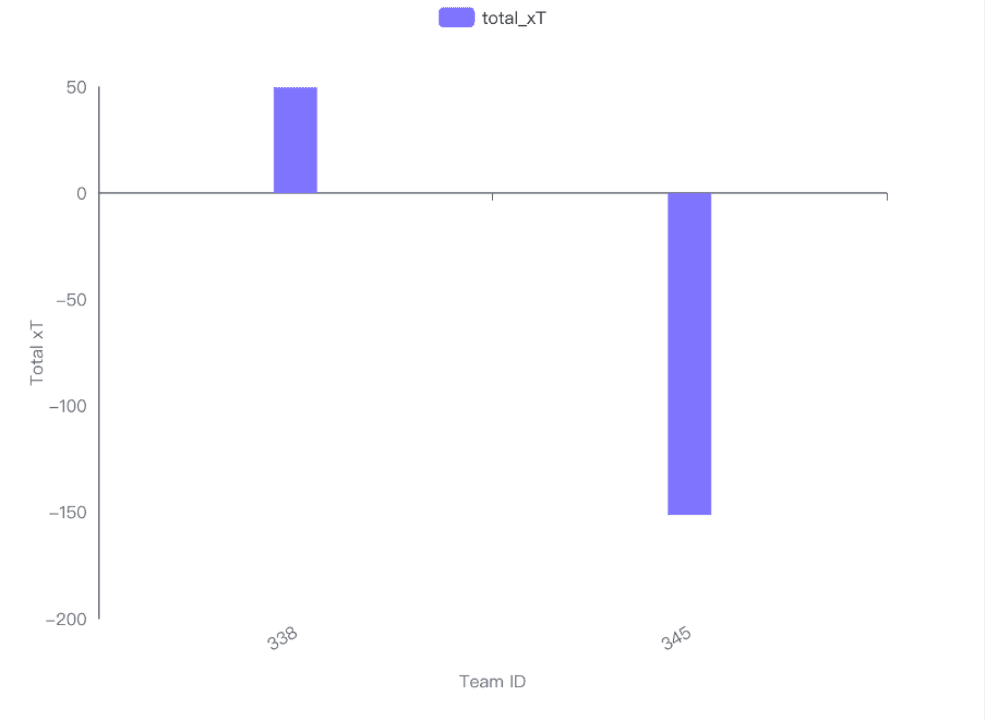
The analysis of team contributions revealed:
Team ID 338 had a positive xT total of 49.62, indicating effective offensive plays.
Team ID 345 had a negative xT total of -151.21, suggesting less effective or risky plays that could have led to dangerous counter-attacks by the opposition.
Visualization
The bar chart for team xT contributions visually represents the stark contrast between the two teams, with Team ID 338 showing positive contributions and Team ID 345 displaying a significant negative total.
Conclusion
Player Analysis:Player ID 122117 emerged as the most impactful player, suggesting his actions during the game were highly effective in creating scoring opportunities or threatening situations.
Team Analysis:Team ID 338 was more effective in creating dangerous situations compared to Team ID 345, which might have compromised their defensive stability or failed to capitalize on opportunities.
This detailed xT analysis provides valuable insights into individual and team performances, highlighting key contributors and areas of potential improvement for the teams involved in the Euros Final 2024.
Zone Value
The analysis focuses on the significant events during the Euros Final 2024, specifically examining how different zones on the pitch contributed to overall threat and goal opportunities. The data includes events such as passes, shots, and dribbles, filtered to highlight their start and end zones.
Key Findings
High Activity Zones:
Midfield Right: This zone shows the highest activity, particularly in transitions from Midfield Right to Midfield Center, with 95 events noted. This suggests a strategic focus on utilizing the right side of the midfield to advance plays.
Midfield Left: Significant activity was also observed in the Midfield Left, especially transitioning to Midfield Center with 72 events. This indicates balanced play across the field.
Threat and Goal Opportunity Zones:
Attacking Zones: The Attacking Left and Attacking Center zones are crucial for creating scoring opportunities. The heatmap shows considerable transitions within these zones, suggesting effective penetration into the opponent's defensive half.
Defensive to Midfield Transitions: There is a notable number of events moving from Defensive Center to Midfield Center (36 events) and from Defensive Left to Midfield Left (31 events), highlighting the importance of these zones in building up attacks.
Zone Efficiency:
Attacking Efficiency: The transition from Attacking Left to Attacking Center (33 events) and vice versa (27 events) indicates a dynamic attacking strategy, utilizing the central and left attacking zones effectively.
Defensive Solidity: The lower number of events starting in the defensive zones and moving towards attacking zones suggests a strong defensive setup that transitions into midfield play rather than direct attacking plays.
Visual Insights
The provided heatmap visually supports the analysis, showing denser colors (indicating higher event counts) in midfield zones and transitions between midfield and attacking zones. This visualization helps in understanding the flow and focus of the game during significant events.
Strategic Implications
Midfield Dominance: The data suggests that control and activity in the midfield, especially on the right and left flanks, are crucial for setting up goal opportunities.
Balanced Attack: The effective use of both left and right attacking flanks indicates a well-rounded offensive strategy.
Defensive Transition: The ability to transition from defensive zones to midfield efficiently is key to maintaining pressure and building attacks.
Overall, the analysis of start and end zones for significant events during the Euros Final 2024 highlights the strategic areas of the pitch that contributed most to creating threats and goal opportunities. The midfield zones, particularly on the right, play a pivotal role in game dynamics, supporting both defensive solidity and offensive opportunities.
Try Now
Try Powerdrill AI now, explore more interesting data stories in an effective way!