10 Best Tableau Alternatives for Non-Technical Teams in 2026 (Side-by-Side Comparison)

Introduction
Navigating the world of data visualization can be incredibly daunting for everyday professionals. While traditional data platforms are undeniably robust, their steep learning curves often alienate users who lack coding expertise.
Fortunately, modern business intelligence tools have evolved significantly, allowing anyone to turn raw datasets into compelling visual stories without needing SQL or Python.
If you want to empower your entire organization to make data-driven decisions seamlessly, it is time to explore more intuitive options.
What Makes a Great Tableau Alternative for Non-Technical Teams?
No-Code Functionality: Users should be able to create complex dashboards through simple text prompts or drag-and-drop mechanics.
AI-Powered Insights: The best tools leverage artificial intelligence to automatically clean data, suggest chart types, and highlight trends.
Seamless Collaboration: Non-technical teams need easy ways to share interactive links or embed charts directly into everyday workflows.
Gentle Learning Curve: A great alternative should require minutes, not weeks, to master, allowing teams to be productive on day one.
Quick Comparison Table
Product | Best For | Ease of Use | Starting Price |
AI-driven insights & no-code charting | ⭐⭐⭐⭐⭐ | ||
Stunning AI presentations | ⭐⭐⭐⭐ | ||
Chat-based data analysis | ⭐⭐⭐⭐ | ||
Quick deck & doc generation | ⭐⭐⭐⭐⭐ | ||
Search-driven enterprise analytics | ⭐⭐⭐ | ||
Automated slide creation | ⭐⭐⭐⭐ | ||
Self-service data discovery | ⭐⭐⭐ | Custom | |
Spreadsheet-style BI | ⭐⭐⭐ | Custom | |
SQL & Python Pro Analysts | ⭐⭐⭐ | Custom | |
Mobile-first cloud BI | ⭐⭐⭐ | Custom |
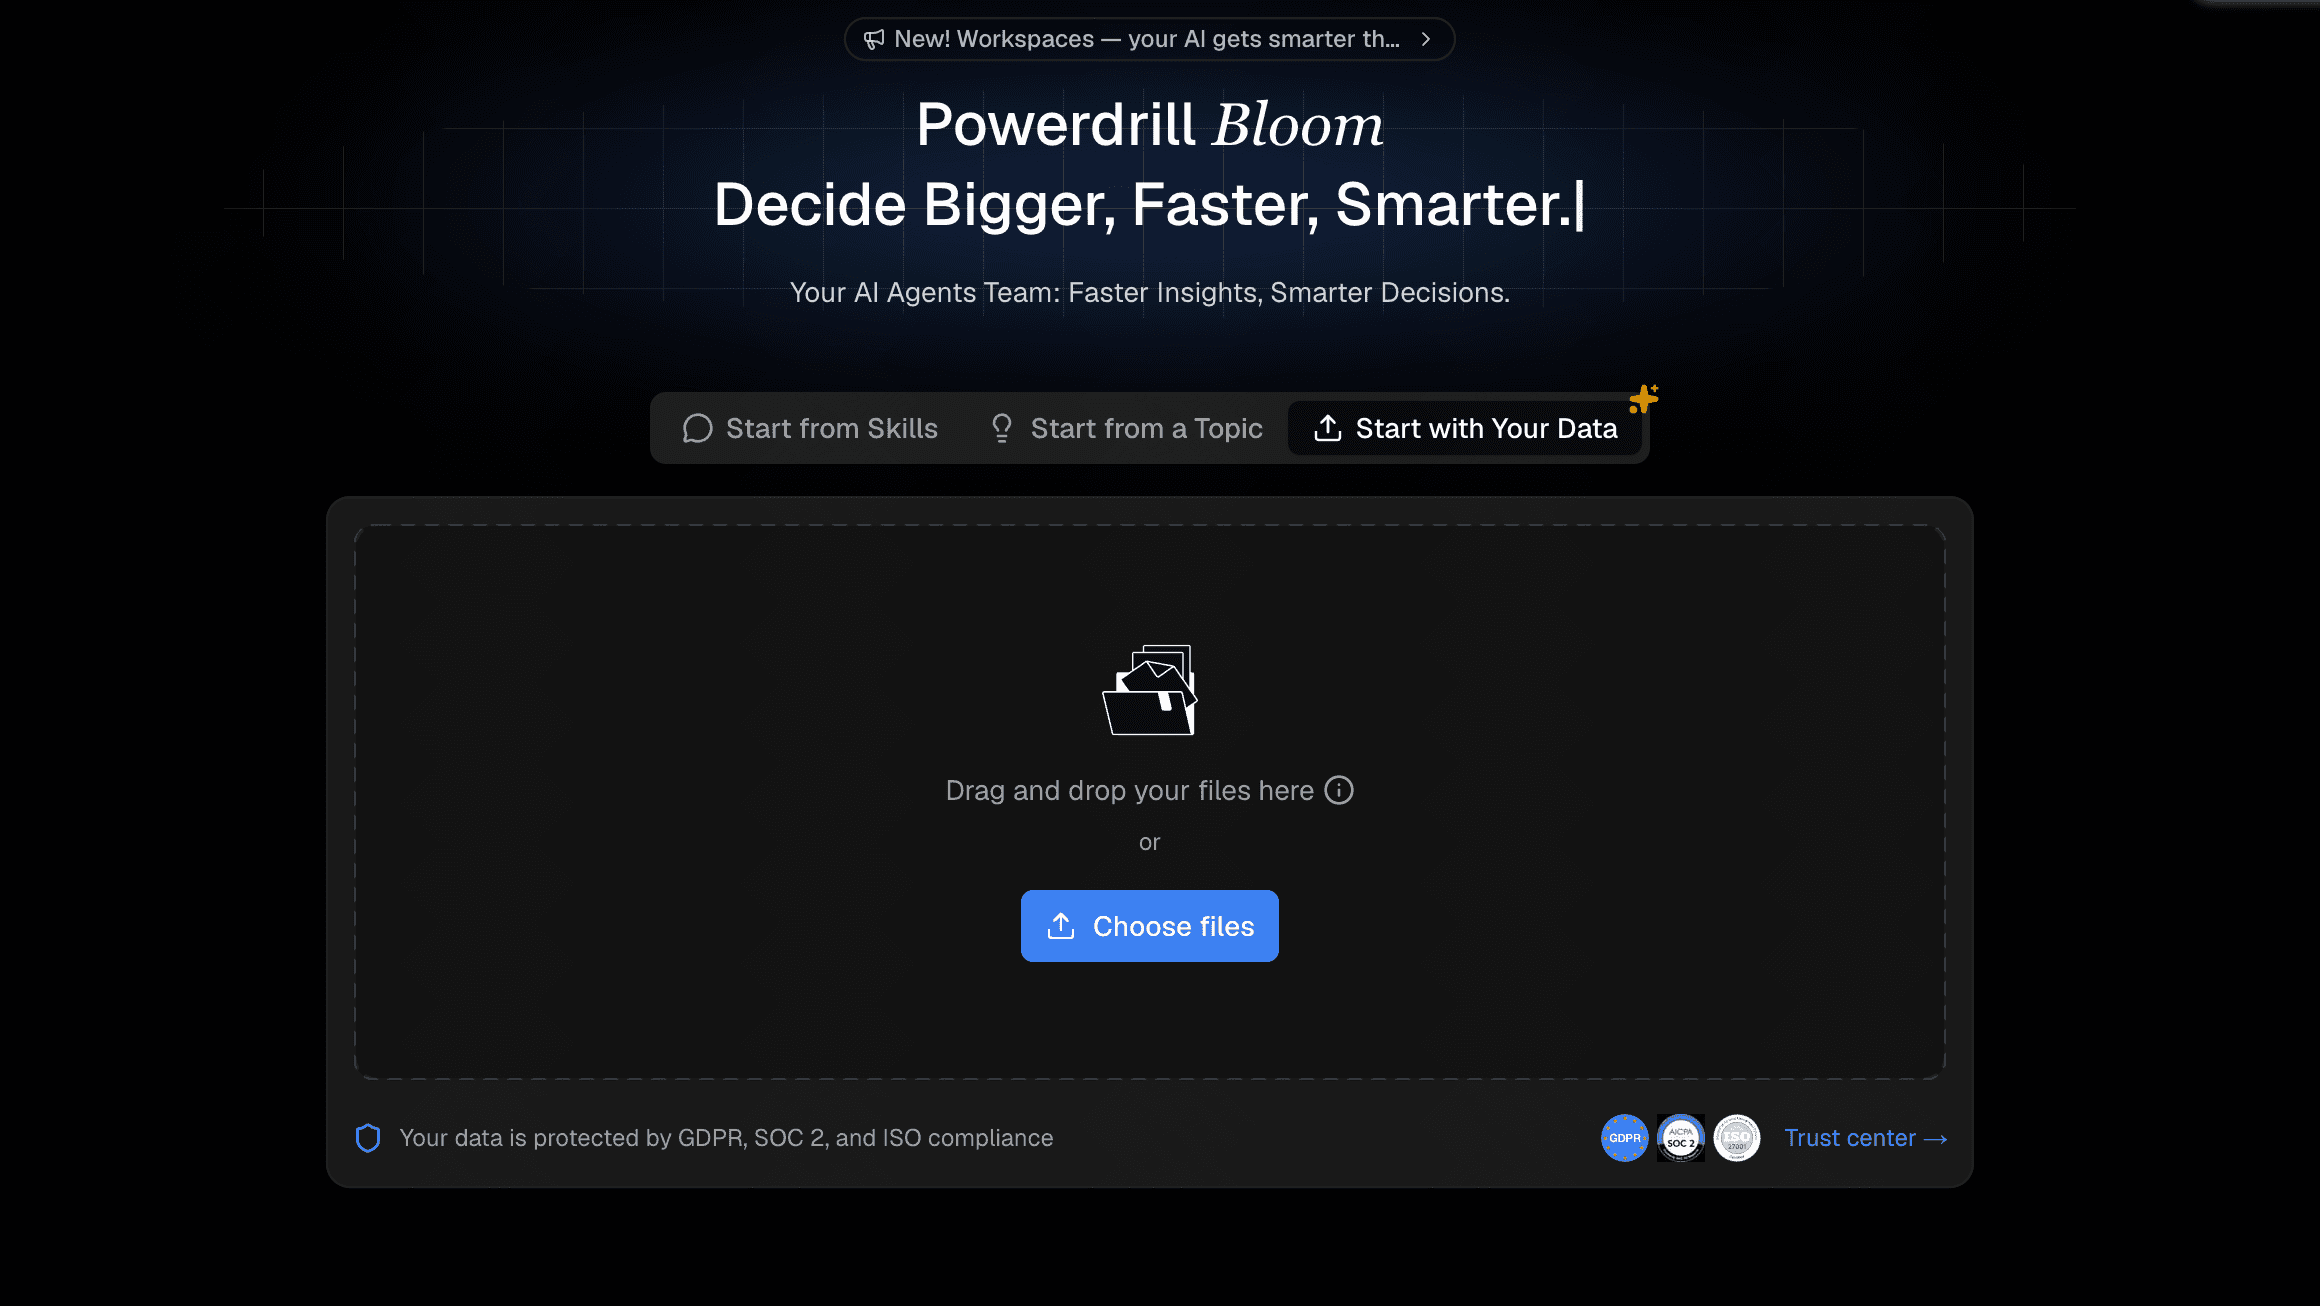
1. Powerdrill Bloom
Powerdrill Bloom is an innovative, AI-native data platform designed specifically to bridge the gap between complex datasets and non-technical users. It acts as an intelligent assistant that turns your raw files into interactive data apps instantly.
Key Features
Natural language processing for immediate chart generation.
Automated data cleaning and smart formatting.
Instant sharing via interactive links and embedded web apps.
Pros
Zero technical skills required; fully prompt-driven.
Incredibly fast deployment from raw data to finished visuals.
Superior AI accuracy in understanding conversational queries.
Cons
Relatively new to the legacy enterprise market.
Requires internet access for cloud-based AI processing.
Pricing
Offers a generous freemium model; pro start at $13.27/month.
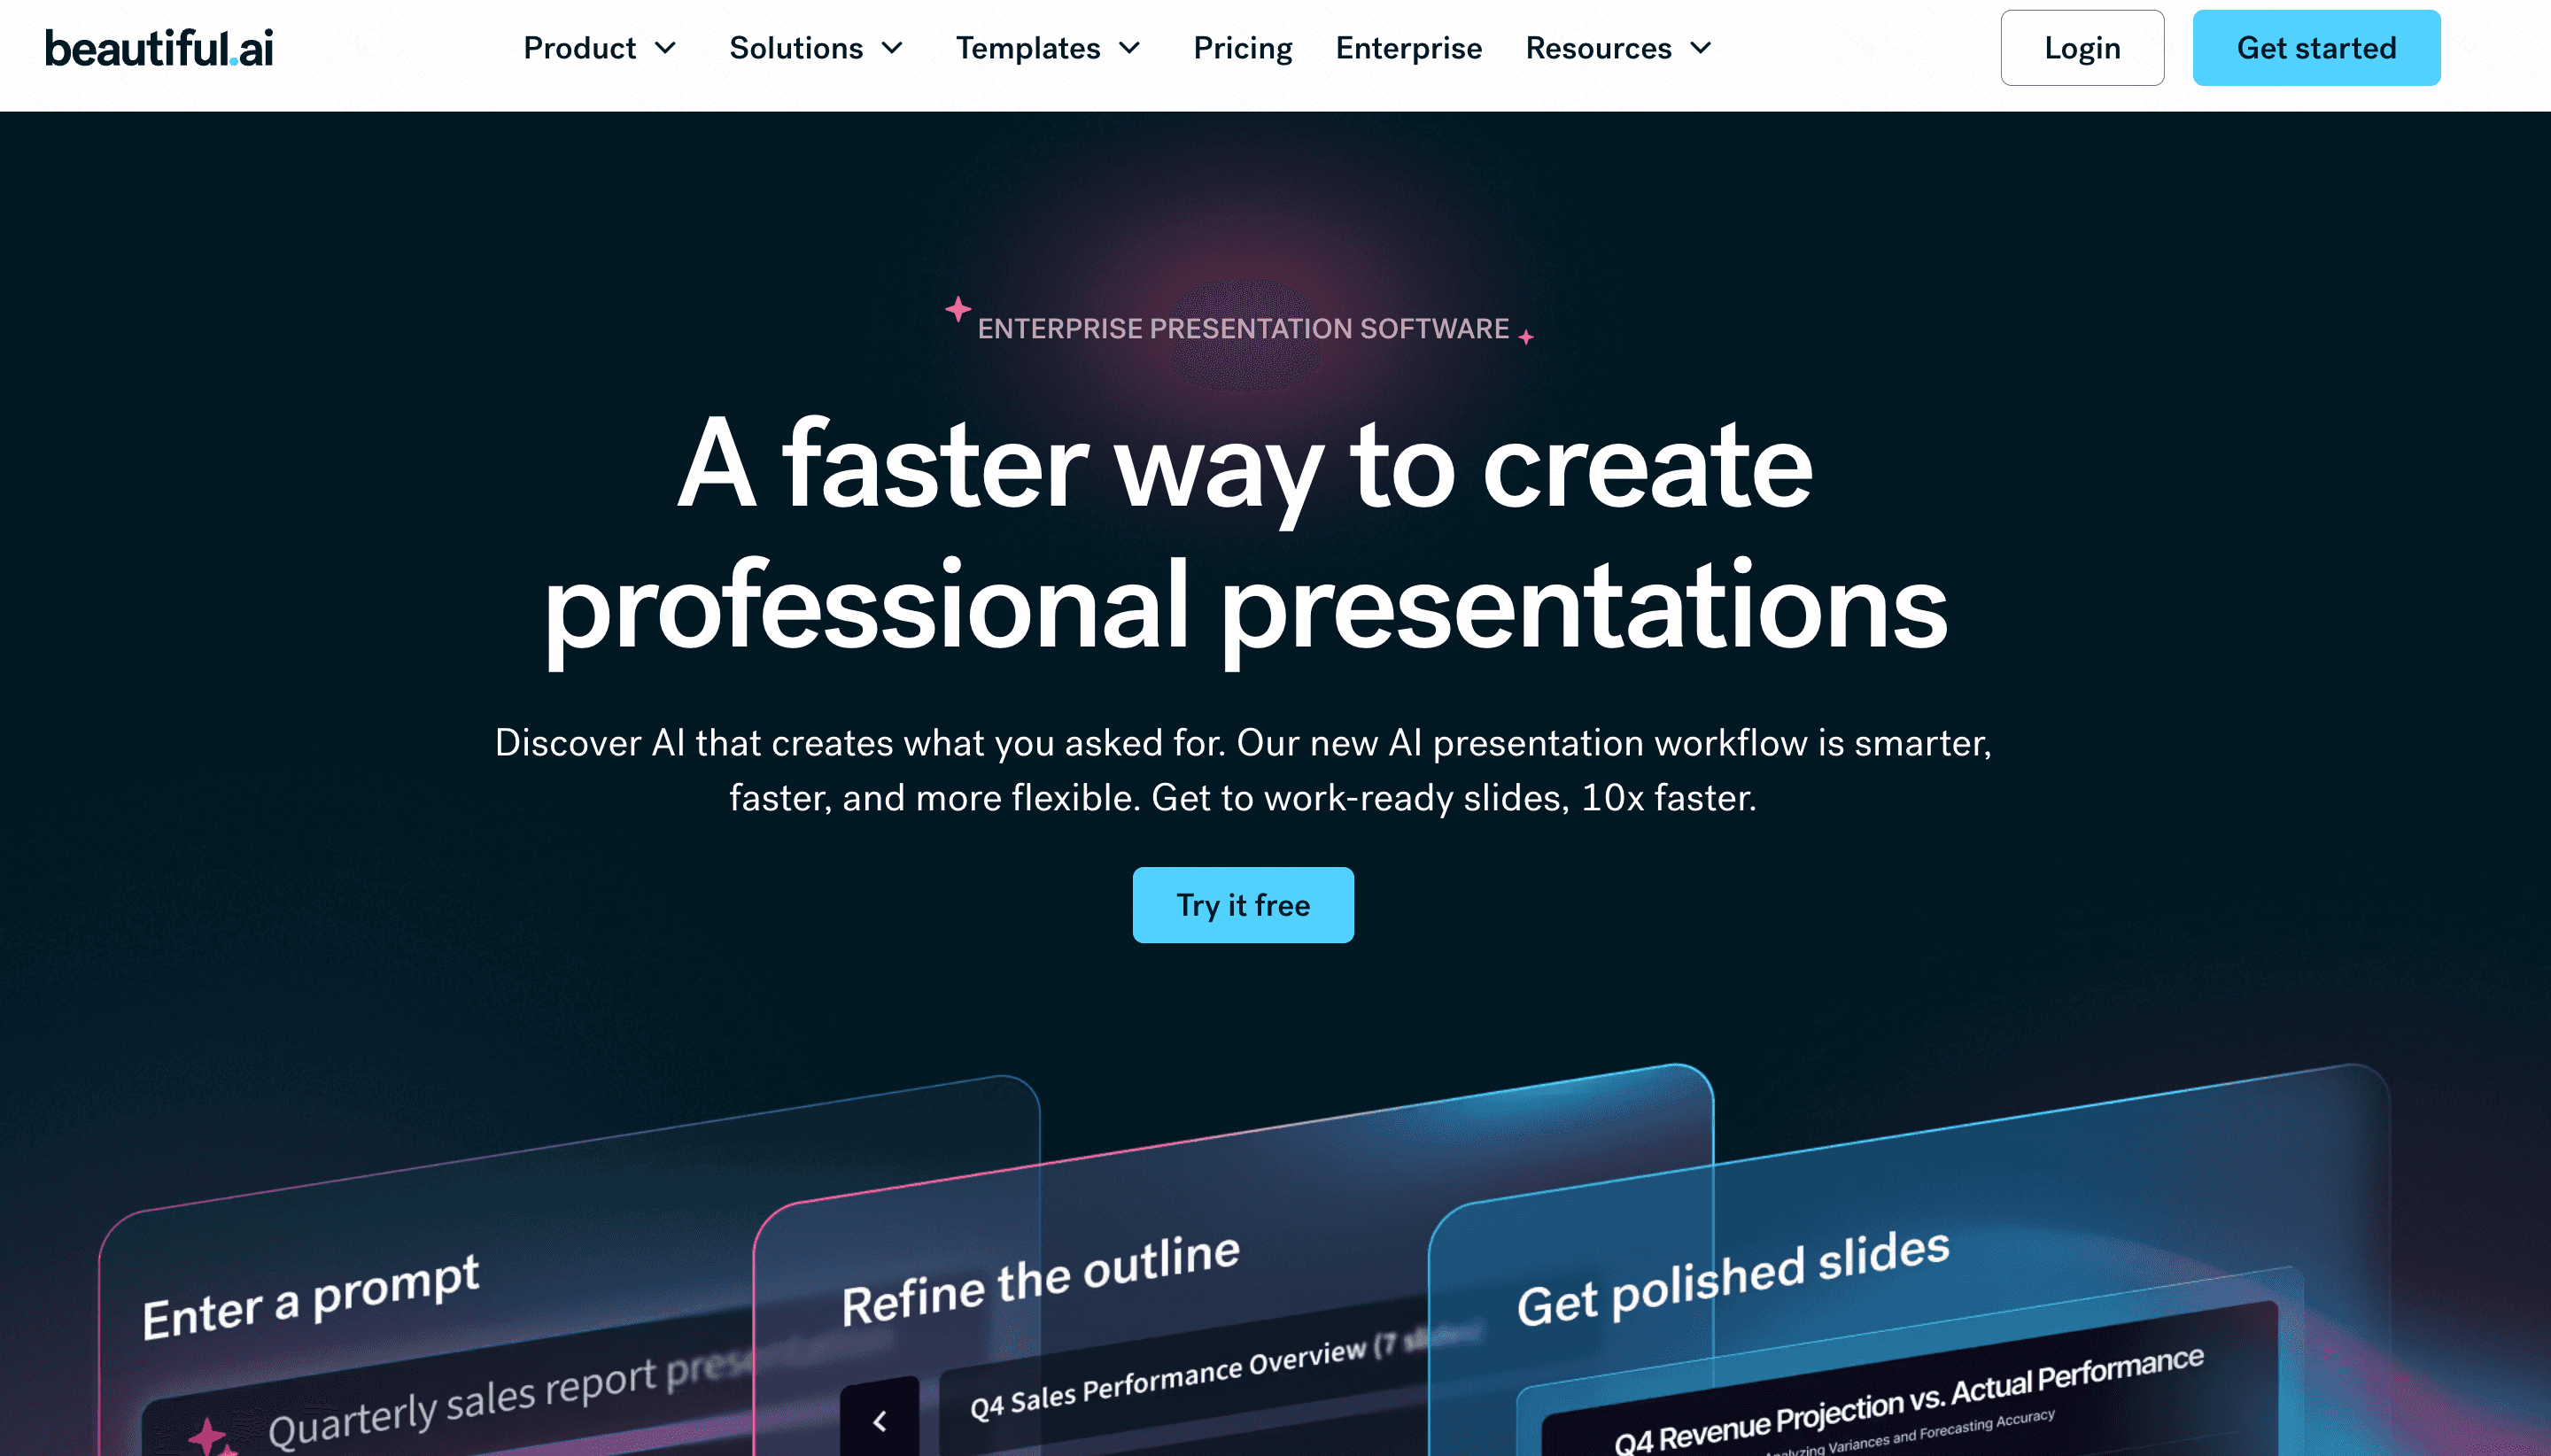
2. Beautiful AI
Beautiful AI is a presentation-focused platform that automatically formats slides. It is ideal for teams needing to present data aesthetically without designing from scratch.
Key Features
Smart templates that adapt as you add content.
Brand consistency controls.
Basic built-in chart generators.
Pros
Saves hours of design time.
Ensures visually appealing outputs.
Cons
Limited deep-data analysis capabilities.
Chart customization is somewhat rigid.
Pricing
Starts at $12/month (billed annually).
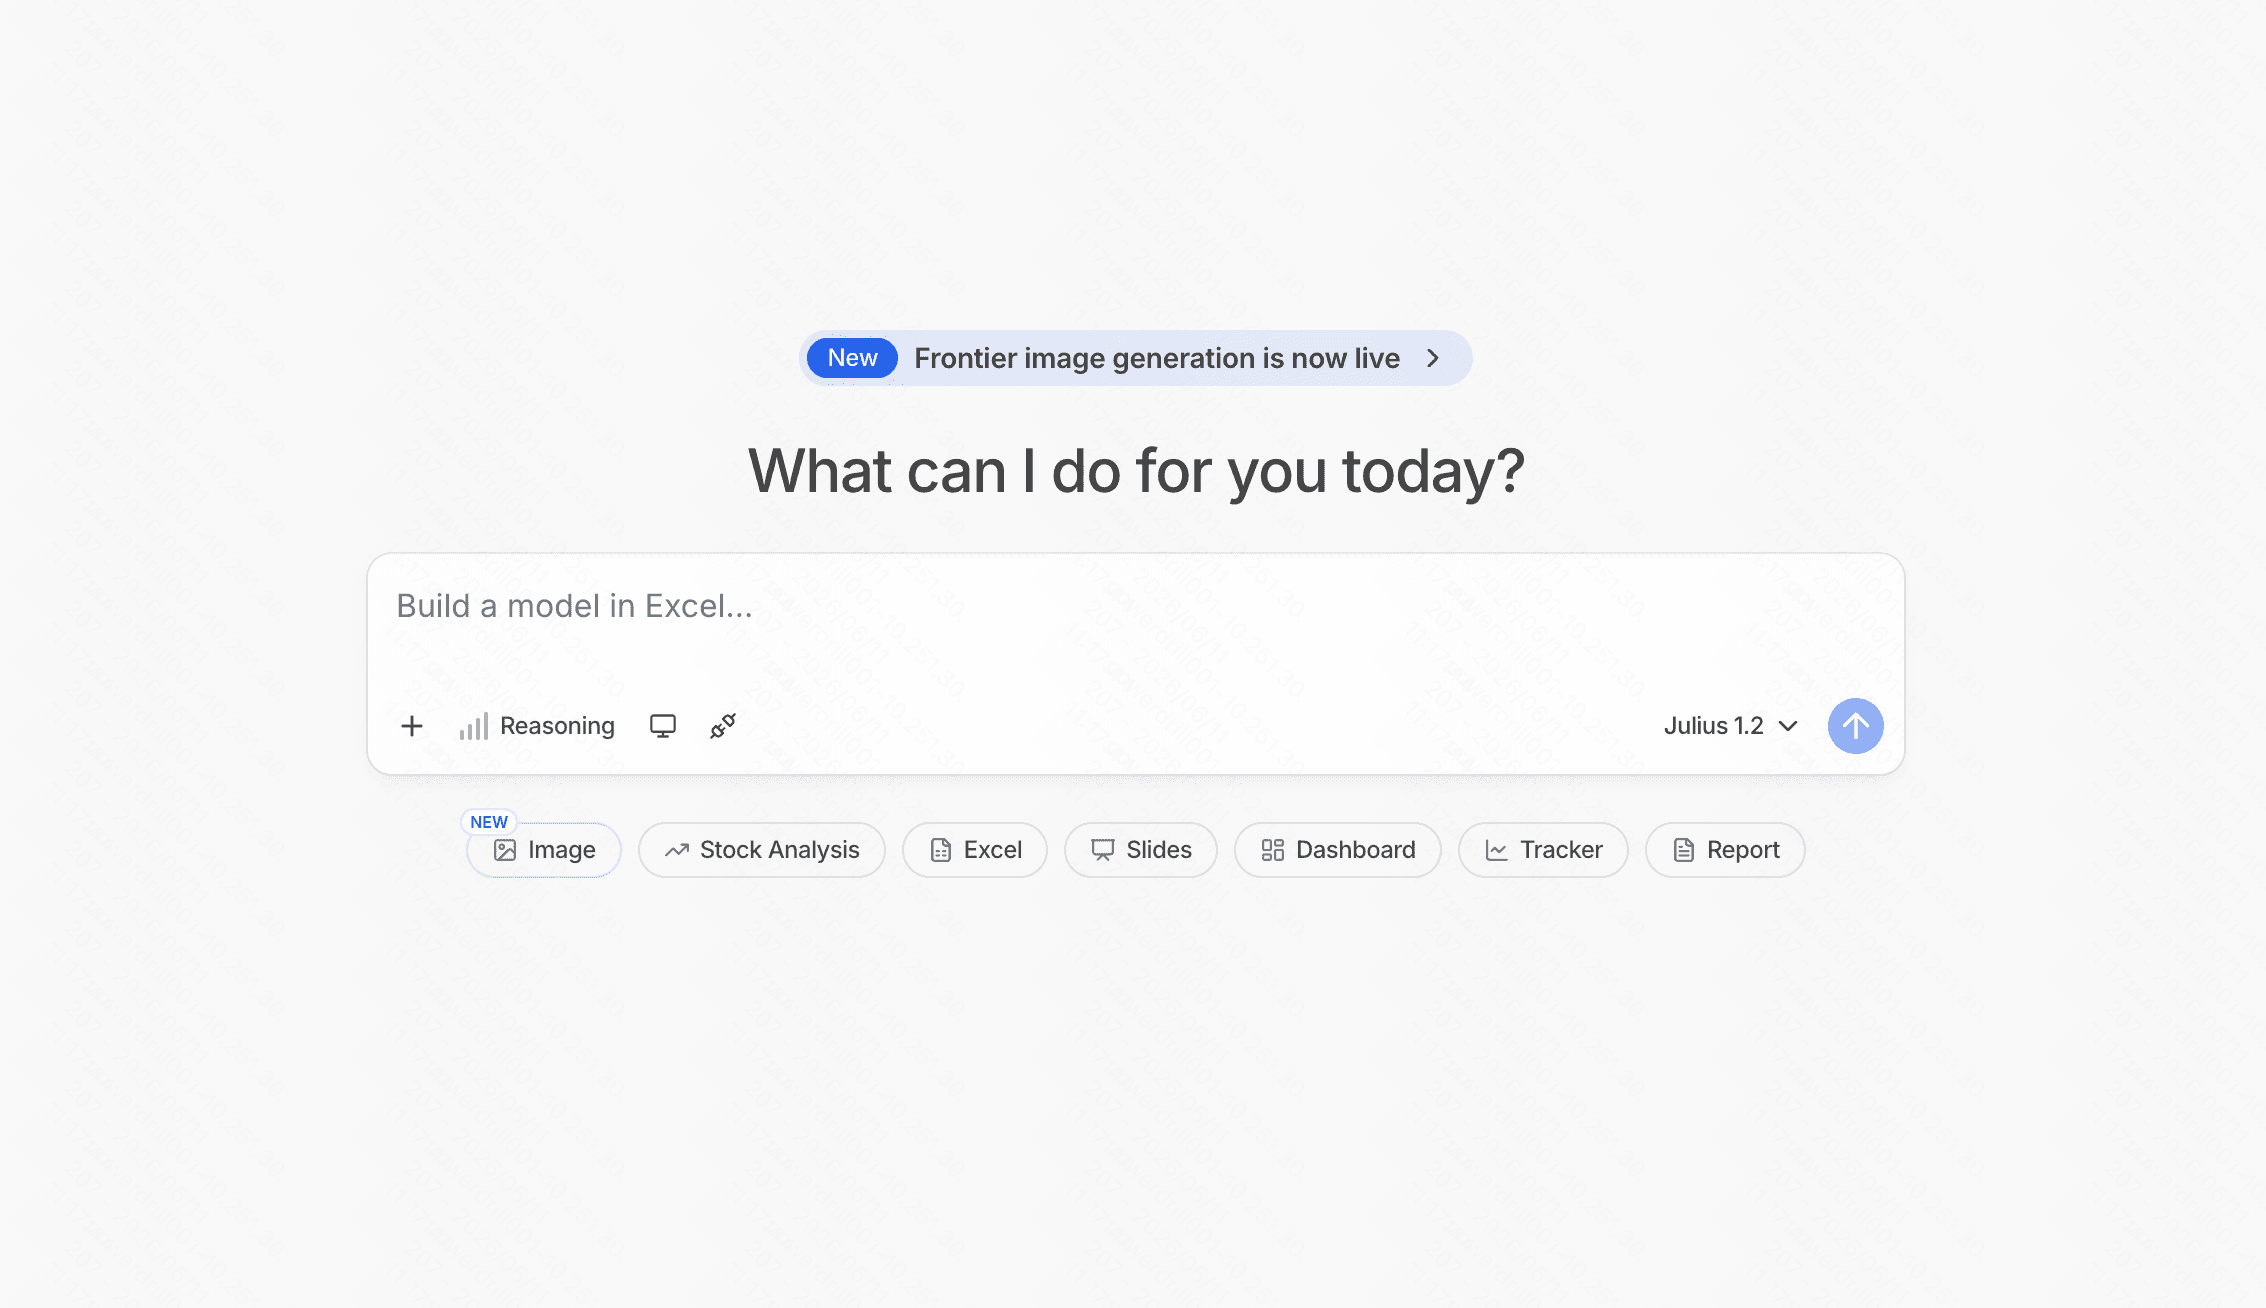
3. Julius AI
Julius AI is a conversational AI data analyst that allows users to chat with their data files to extract insights and generate graphs.
Key Features
Chatbot interface for CSV and Excel files.
Automated statistical modeling.
Downloadable chart images.
Pros
Very intuitive for quick queries.
Handles complex math automatically.
Cons
Visualizations can be somewhat basic.
Lacks enterprise-scale dashboard features.
Pricing
Free basic tier; paid plans start at $20/month.
4. Gamma
Gamma is an AI-powered medium for presenting ideas, bridging the gap between documents, decks, and webpages.

Key Features
One-click AI presentation generation.
Interactive cards instead of traditional slides.
Embedded multimedia support.
Pros
Highly engaging format.
Excellent mobile responsiveness.
Cons
Not a dedicated data visualization engine.
Connecting live databases is challenging.
Pricing
Free tier available; Plus plan starts at $12/user/month.
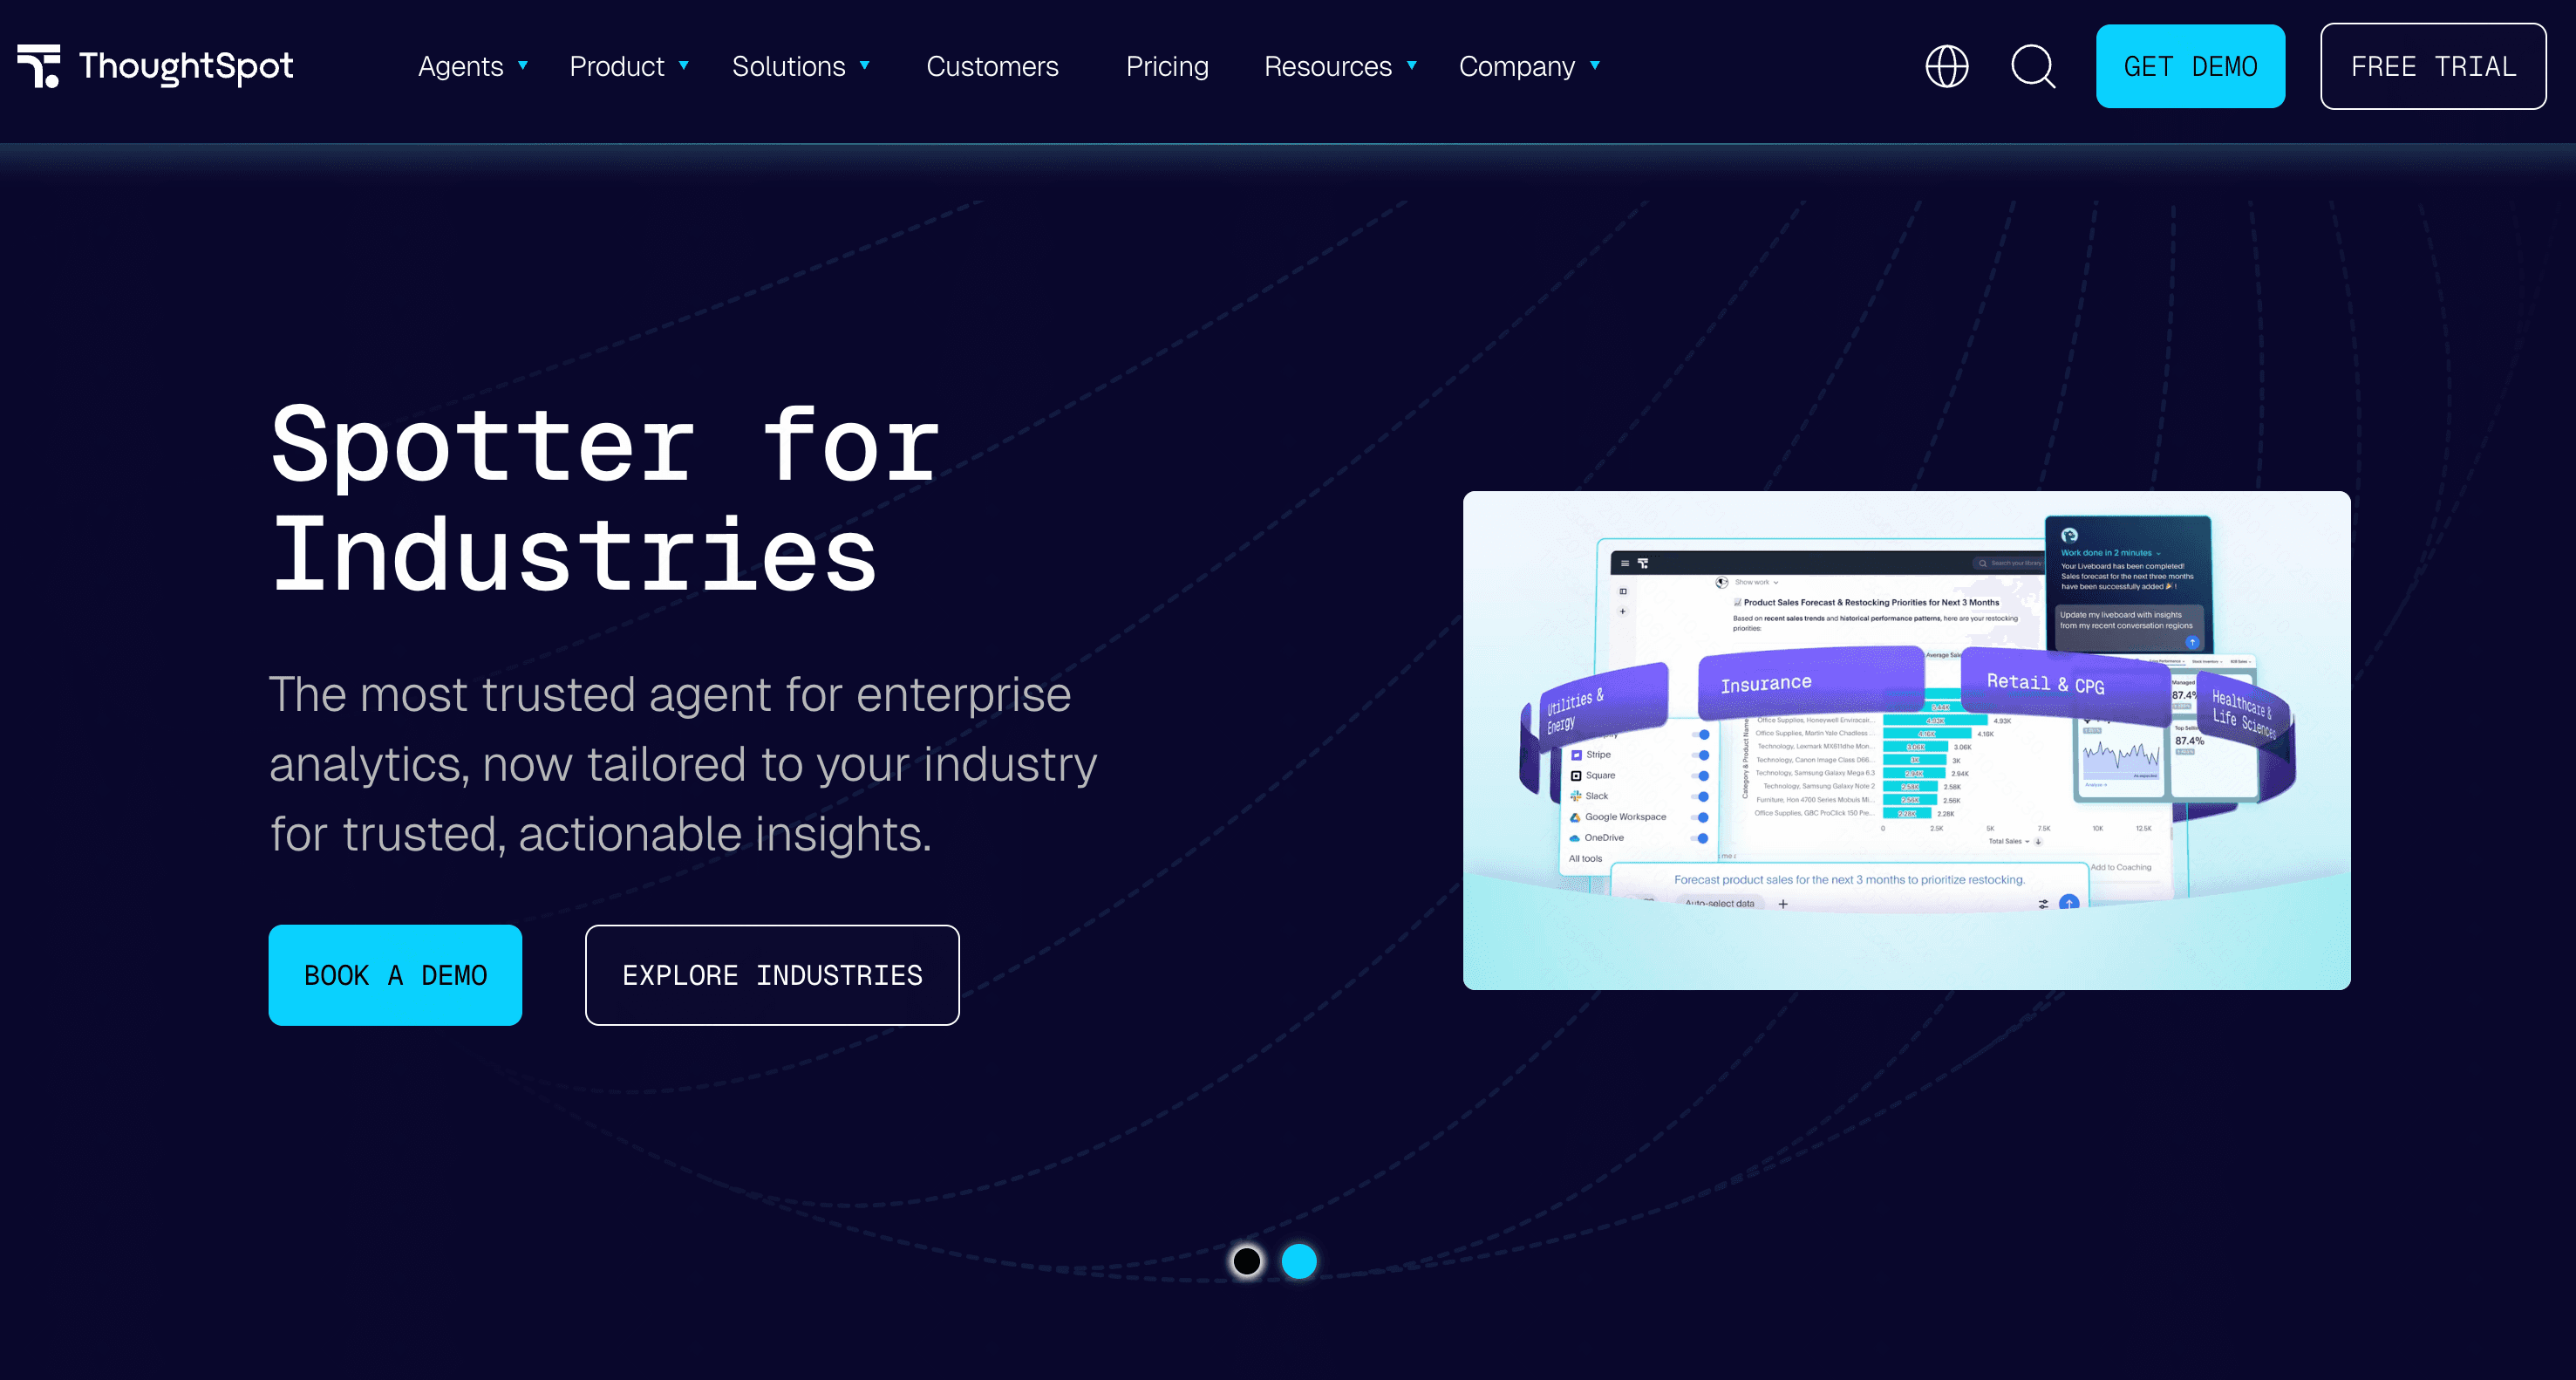
5. ThoughtSpot
ThoughtSpot brings a search engine-like experience to data analytics, allowing users to search their data using natural language.
Key Features
Search-driven analytics.
Liveboards (interactive dashboards).
AI-powered anomaly detection.
Pros
Great for self-service analytics.
Handles massive enterprise datasets well.
Cons
Setup requires technical data modeling.
Steep pricing for smaller teams.
Pricing
Starts at $50/per user month.
6. Decktopus AI
Decktopus AI is an automated presentation maker designed to streamline the creation of slide decks for sales and marketing teams.
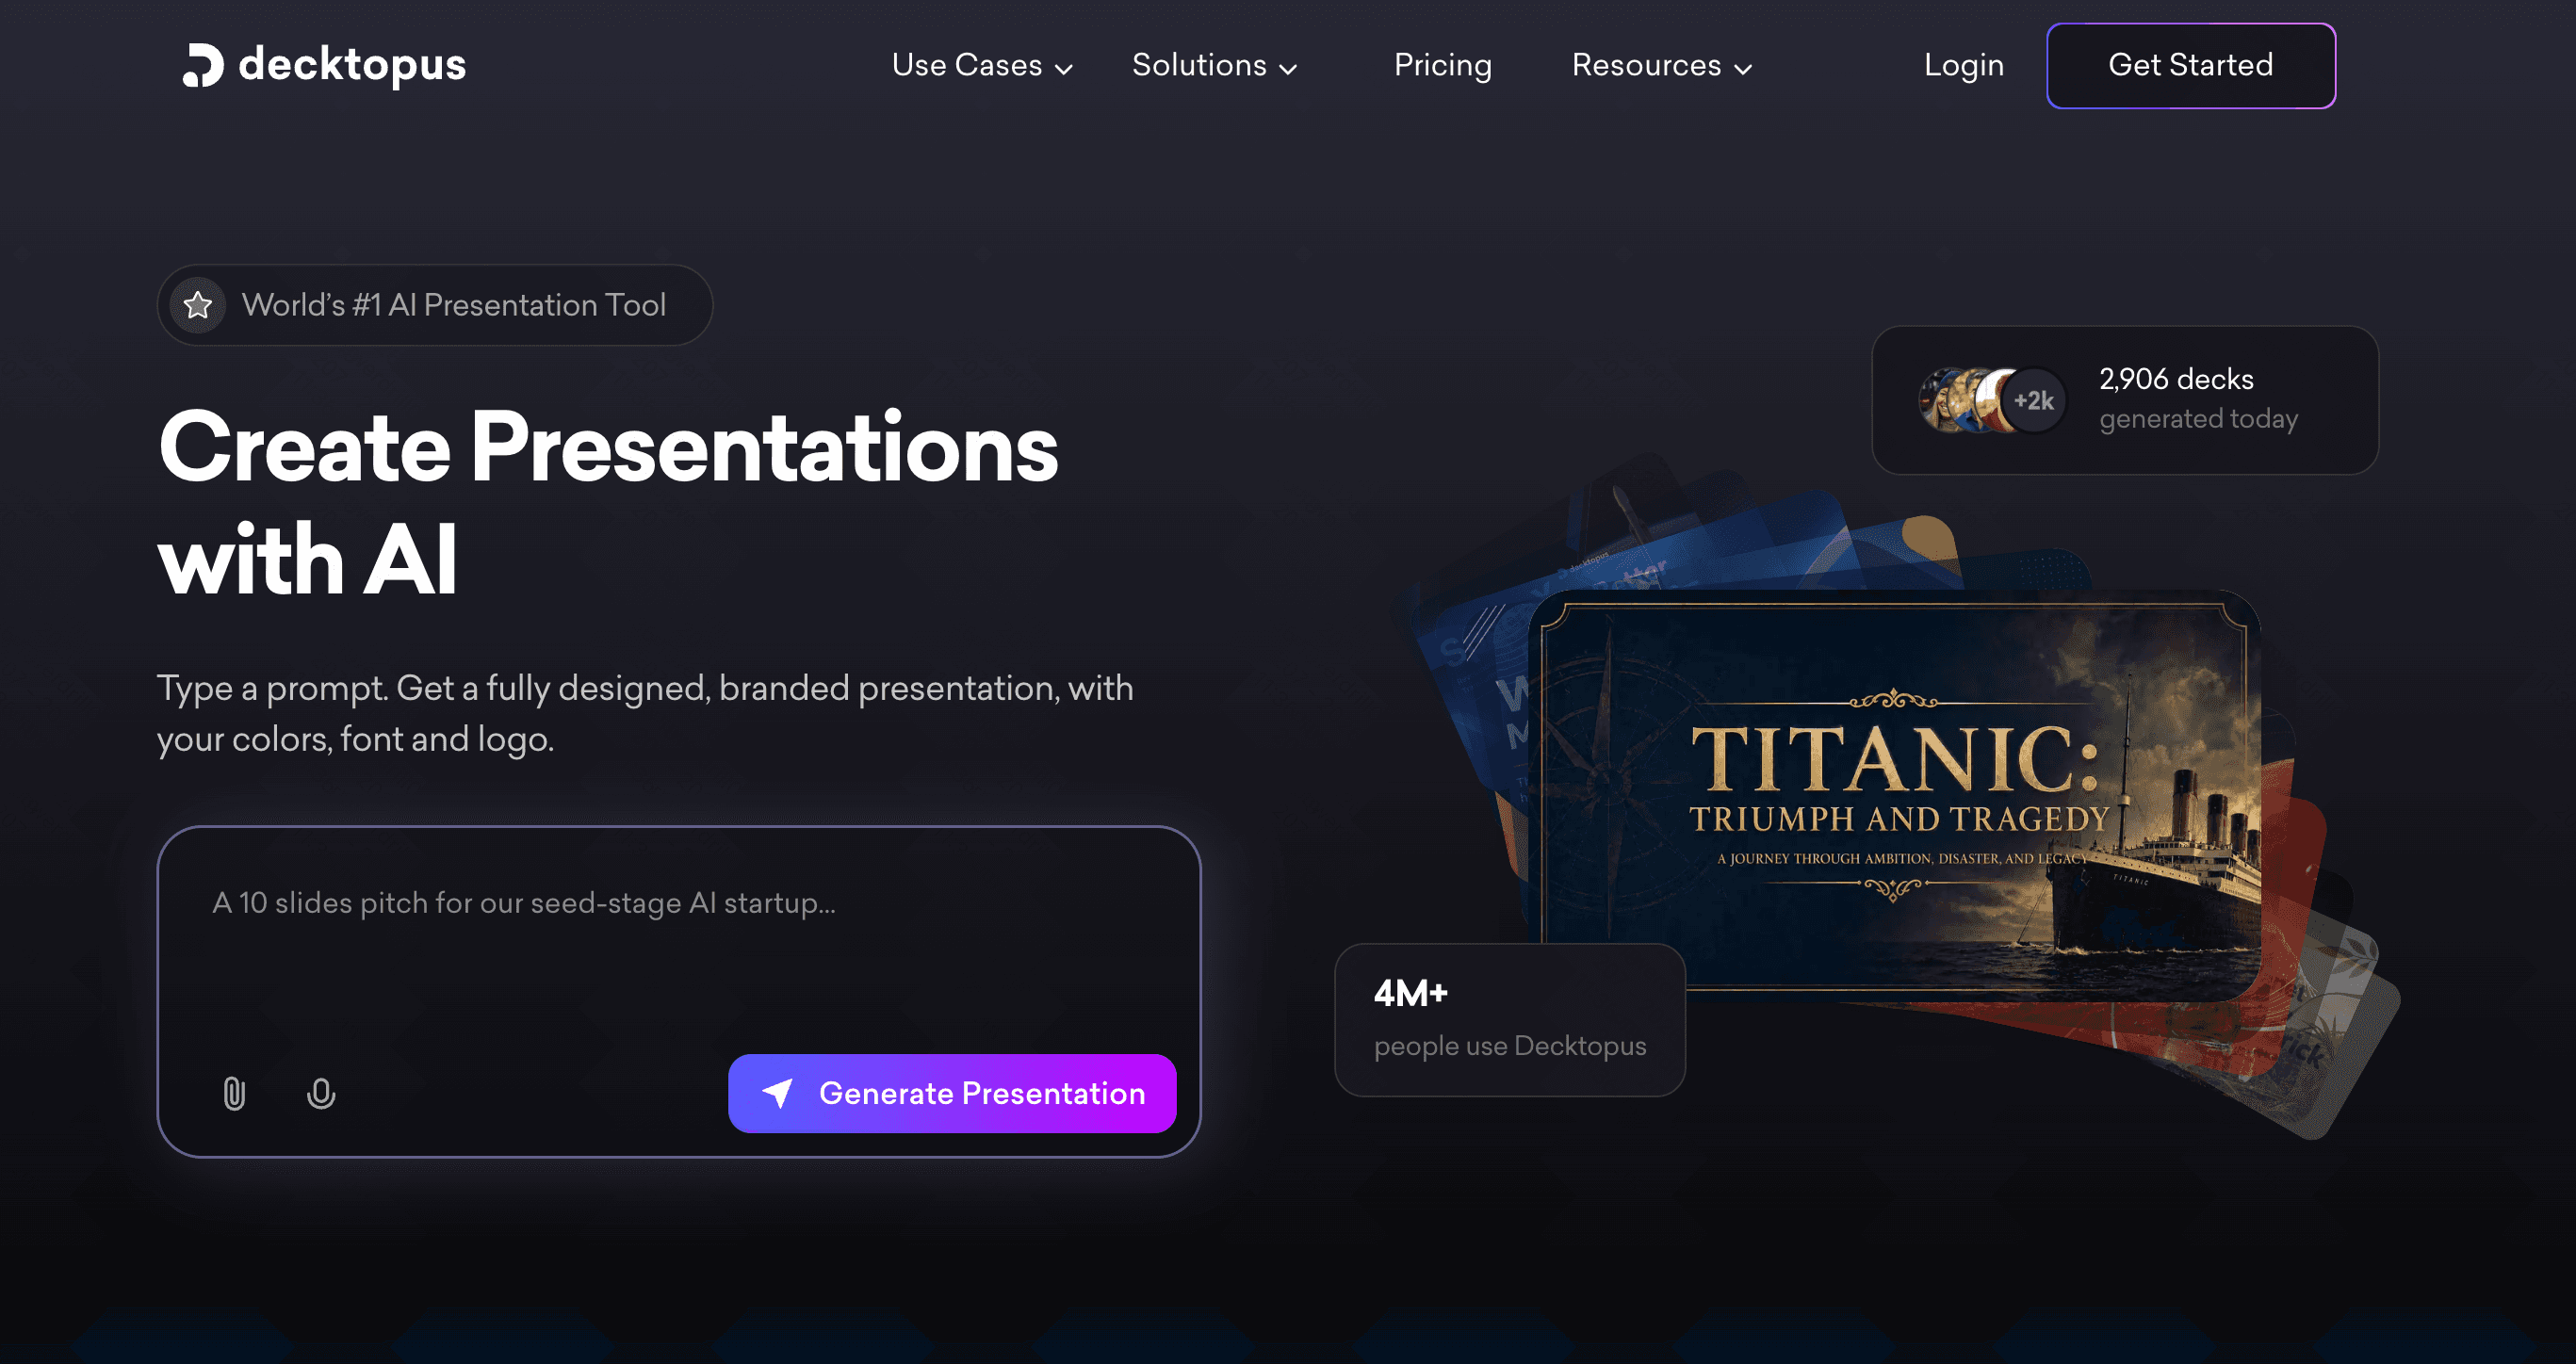
Key Features
AI slide generation based on topic prompts.
Built-in forms and voice recording.
Pre-designed data widgets.
Pros
Extremely fast drafting process.
Good lead generation integrations.
Cons
Very limited BI and data processing tools.
Visuals lack deep interactivity.
Pricing
Starts around $14.99/month.
7. Qlik Sense
Qlik Sense is a mature, self-service BI platform known for its unique associative data engine that helps users explore data freely.
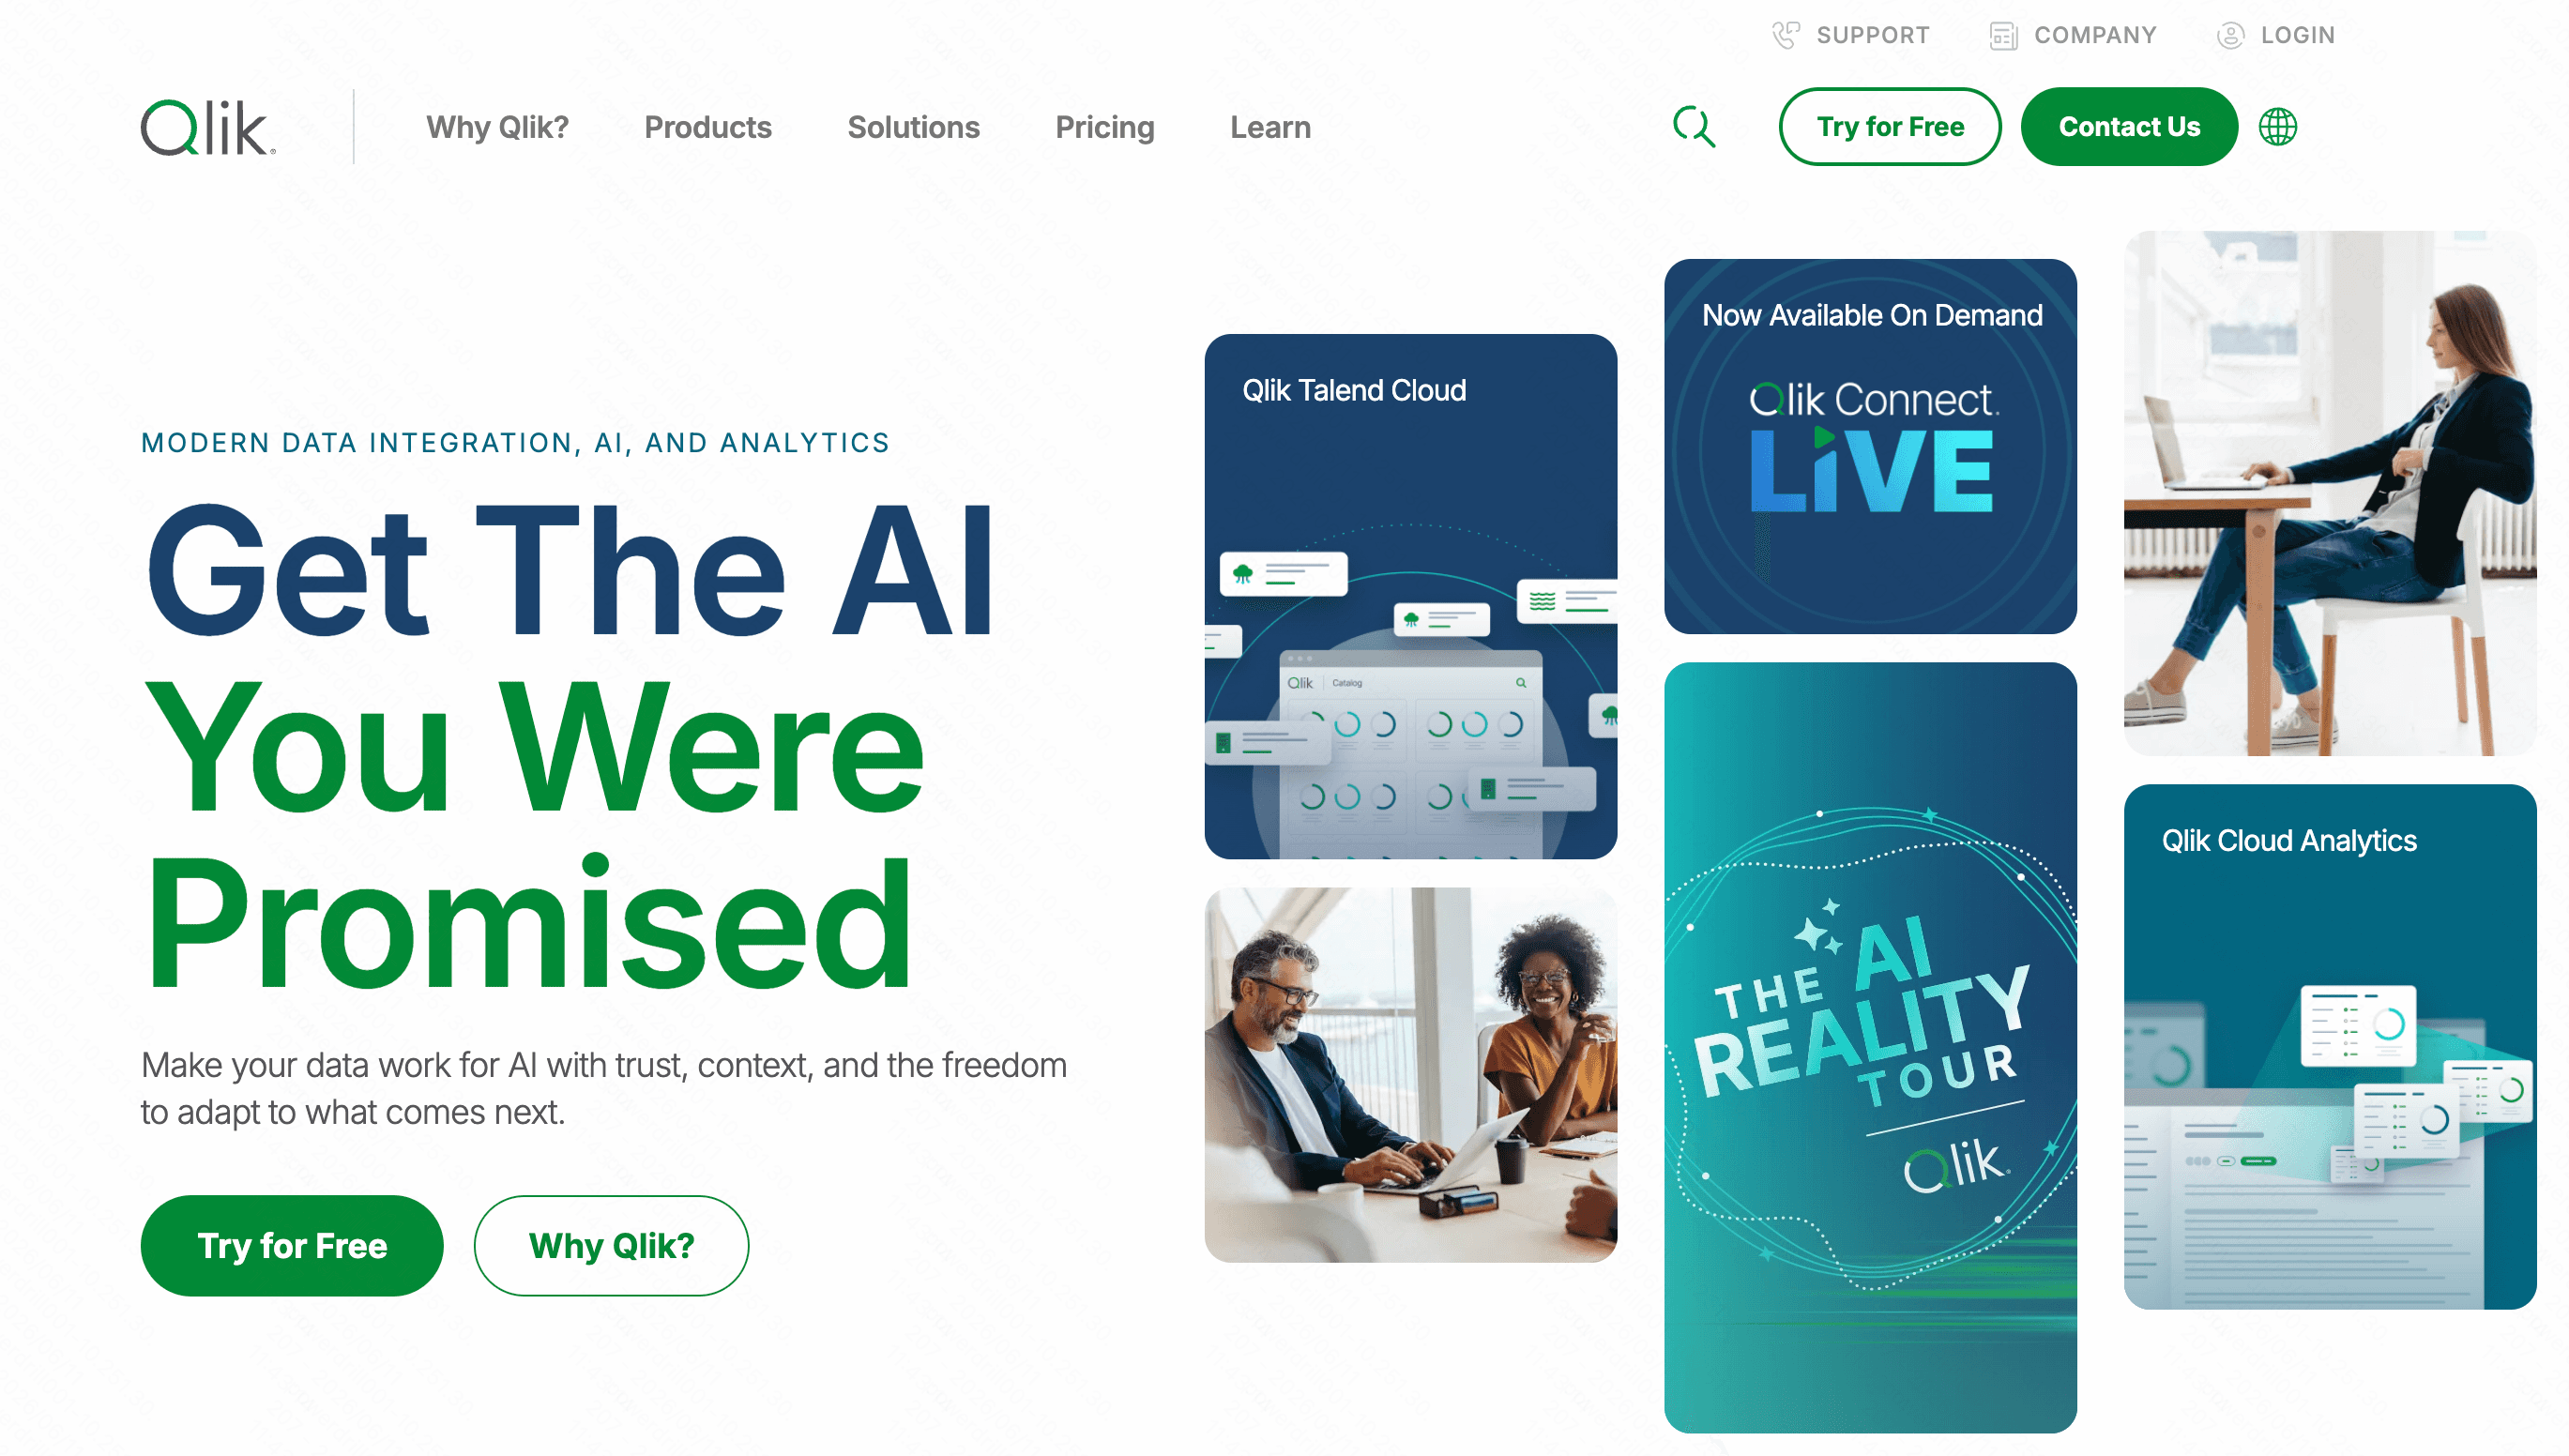
Key Features
Associative engine for data discovery.
Augmented intelligence alerts.
Offline mobile access.
Pros
Powerful data integration.
Highly customizable dashboards.
Cons
Steeper learning curve than pure AI tools.
Interface can feel cluttered to beginners.
Pricing
Custom pricing.
8. Sigma
Sigma is a cloud analytics platform that utilizes a familiar spreadsheet-like interface, making it approachable for users proficient in Excel.
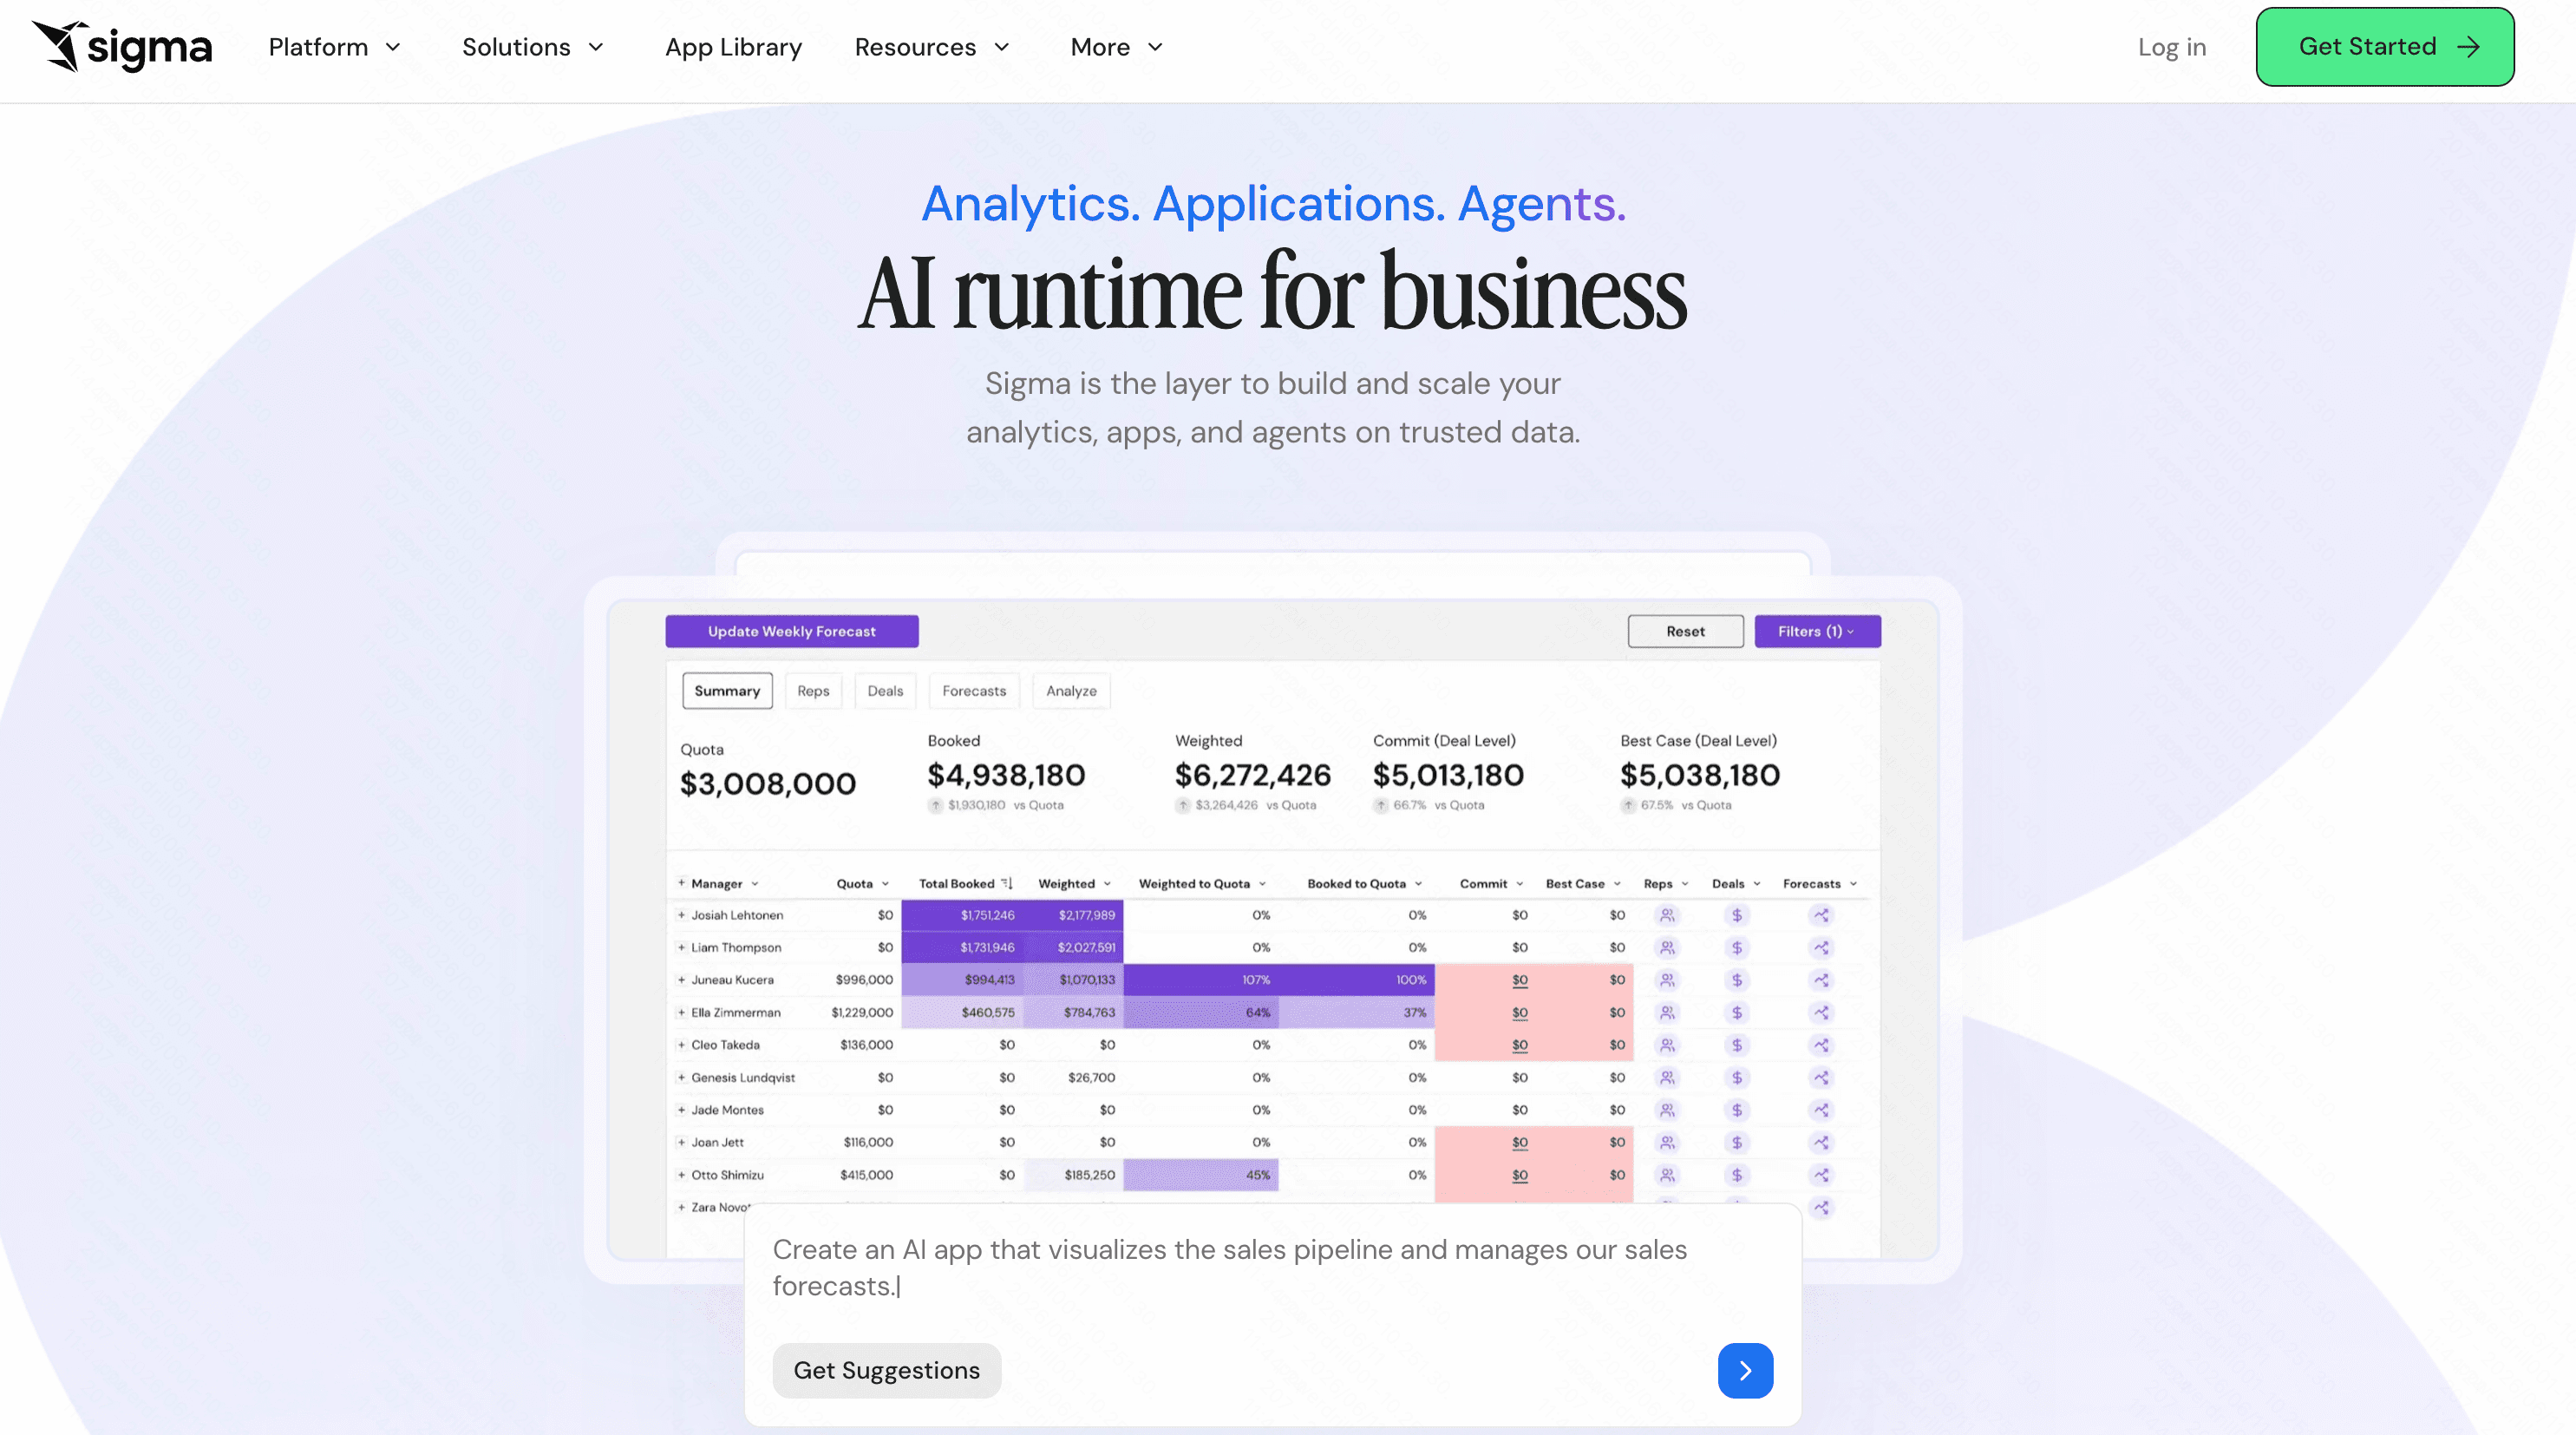
Key Features
Spreadsheet UI for cloud data warehouses.
Real-time data collaboration.
Direct warehouse querying without SQL.
Pros
Familiar interface for business users.
No data extraction required (highly secure).
Cons
Less focus on automated AI generation.
Still requires a basic understanding of data structures.
Pricing
Custom enterprise pricing.
9. Mode
Mode is a collaborative analytics platform that combines SQL, Python, and R into a single notebook environment for data teams.

Key Features
SQL, Python, and R support.
Collaborative analytical notebooks.
Direct code-to-dashboard reporting.
Pros
Unmatched flexibility for data analysts.
Streamlined code-first workflow.
Cons
Requires SQL or coding knowledge.
Steep learning curve for beginners.
Pricing
Free basic tier; custom enterprise pricing.
10. Domo
Domo is a cloud-native platform that integrates data from various sources into a unified, mobile-friendly dashboard system.
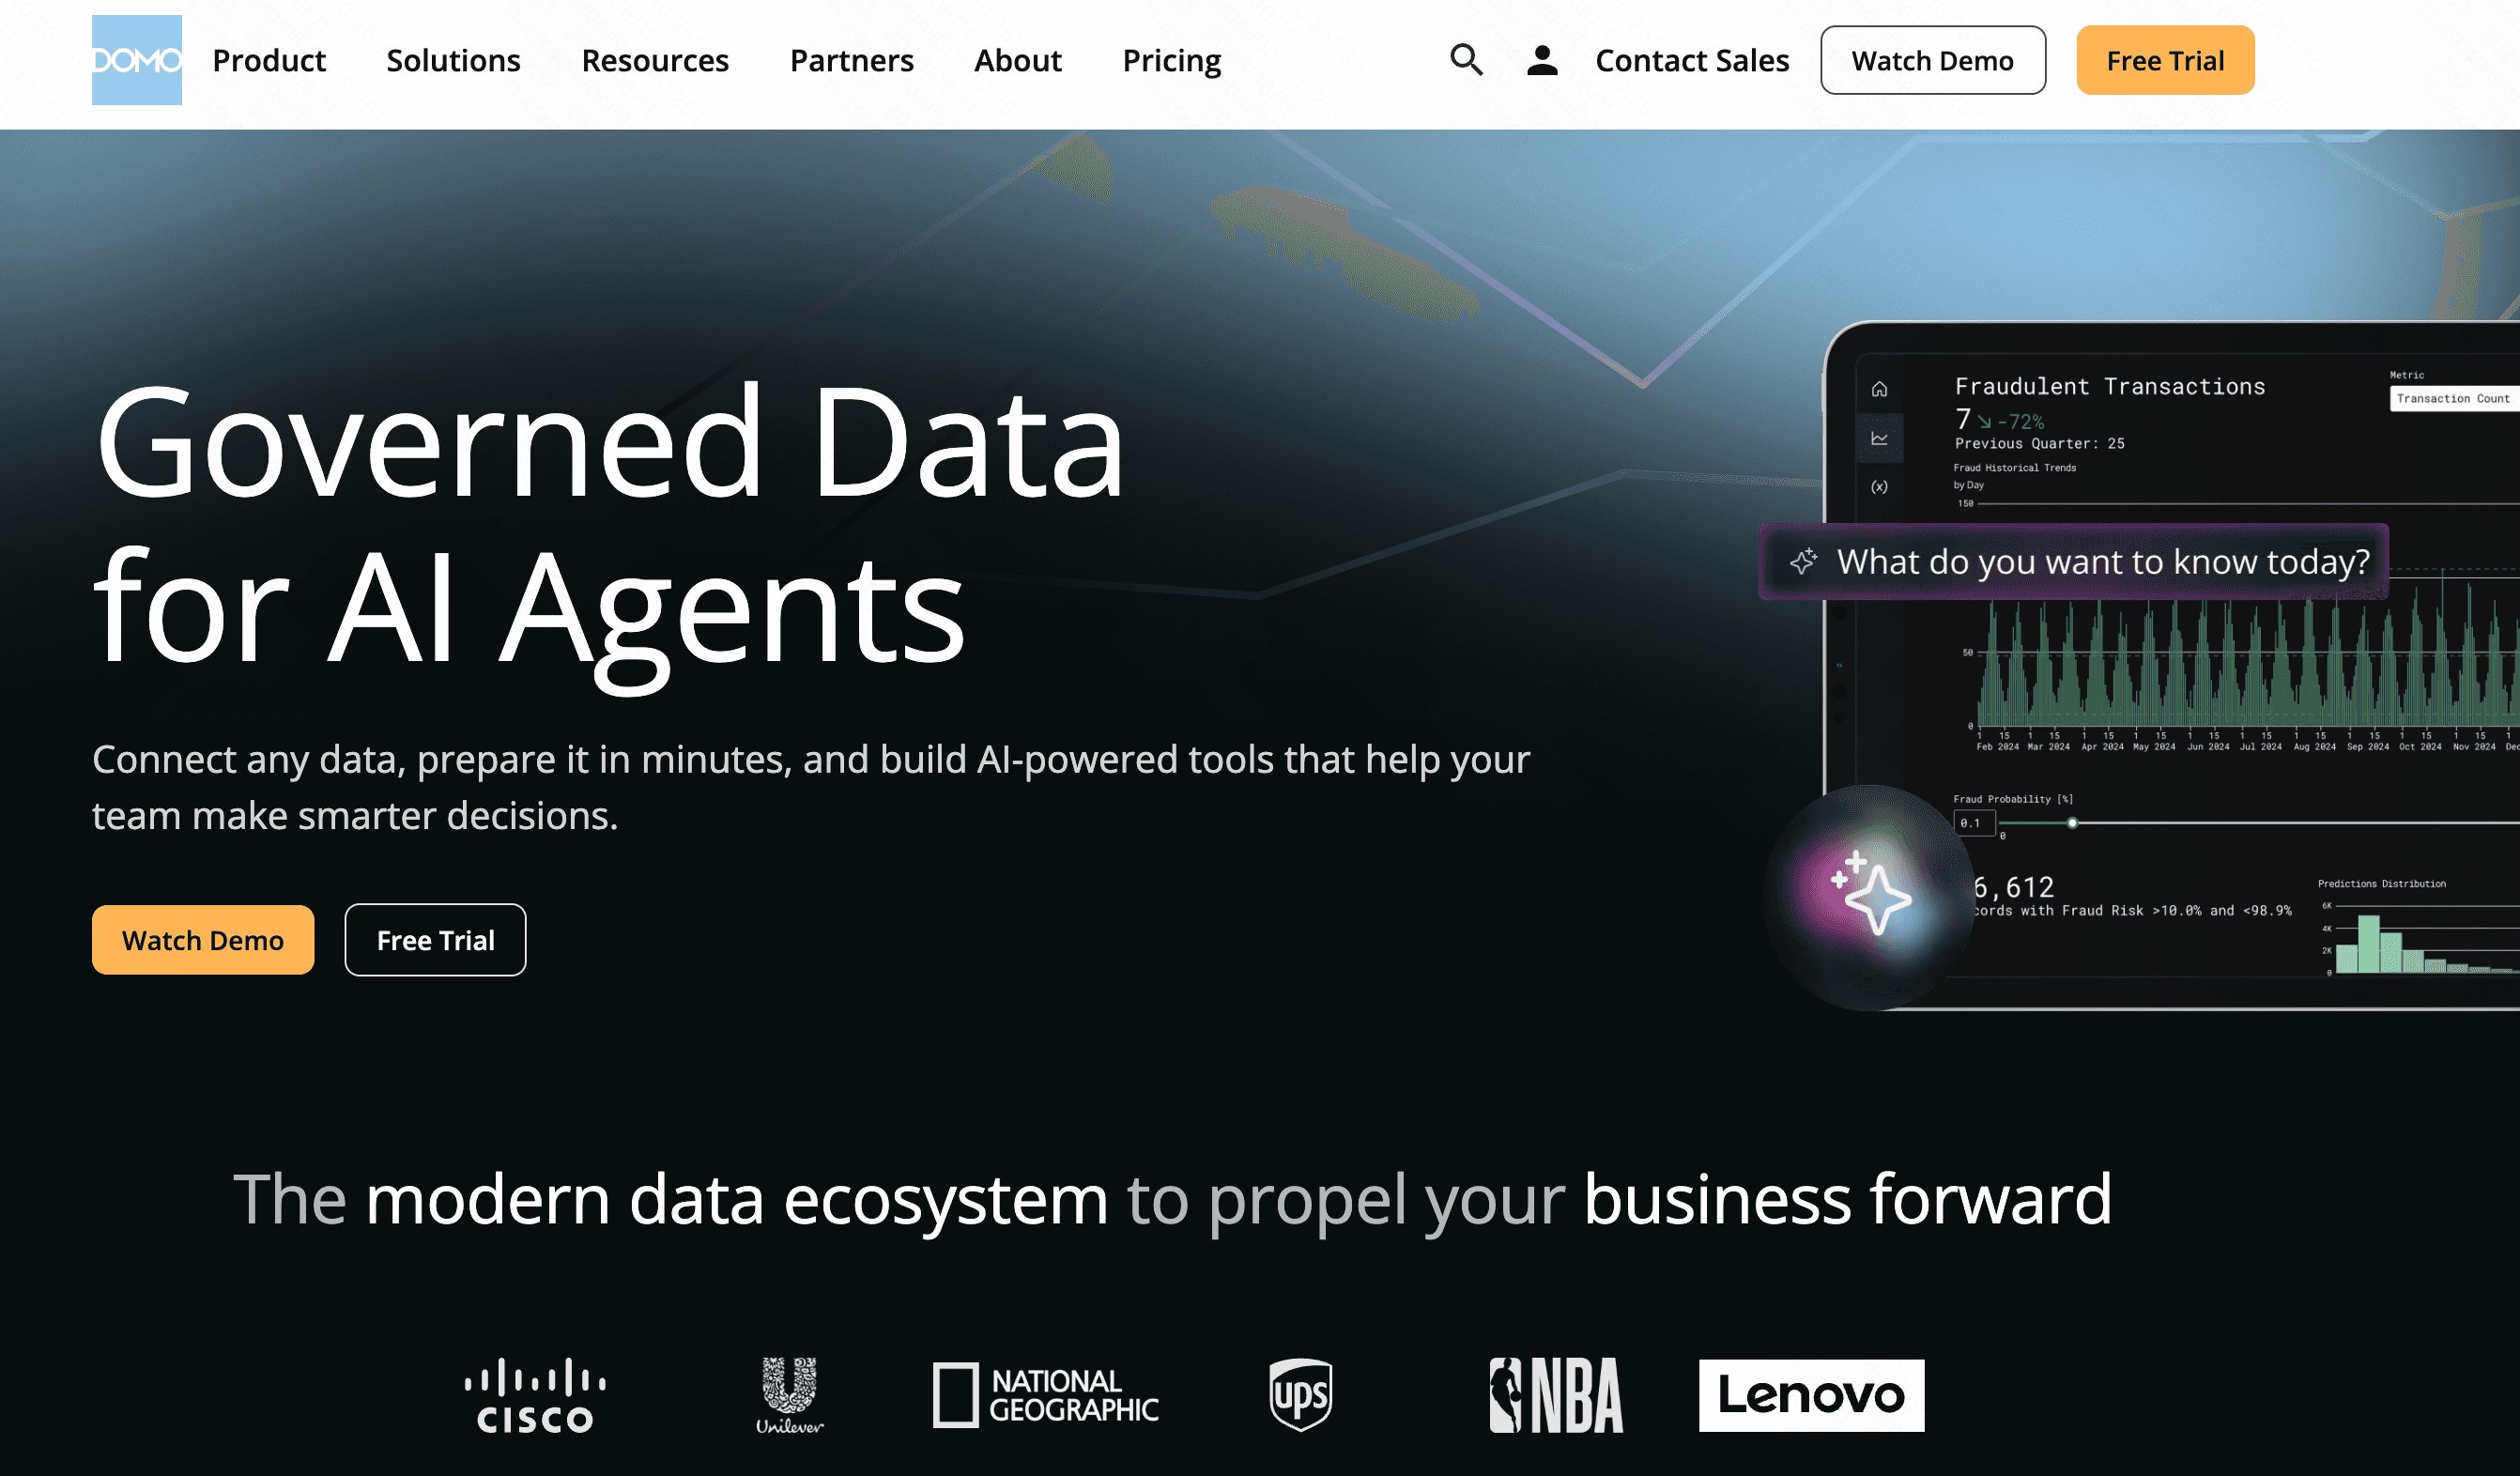
Key Features
Hundreds of pre-built data connectors.
Real-time mobile dashboards.
Low-code app development.
Pros
Unmatched mobile experience.
Excellent at combining disparate data sources.
Cons
Can be overwhelmingly feature-heavy.
Premium pricing model.
Pricing
Custom enterprise pricing.
Tableau vs These Alternatives: Which Tool Is Right for Your Team?
When objectively comparing Tableau to these modern alternatives, the choice boils down to your team's specific capabilities and goals:
For Enterprise Governance: If you have data engineers and need massive scale with strict governance, tools like ThoughtSpot is solid, albeit expensive, choices.
For Presentation Aesthetics: If your primary goal is to make data look pretty in a pitch deck, Beautiful AI or Gamma will serve you better than Tableau.
For Spreadsheet Veterans: Teams glued to Excel formulas will find Sigma a highly productive pivot.
Our Top Recommendation for Non-Technical Users: If you want the power of Tableau without the grueling learning curve, Powerdrill Bloom is the ultimate choice. It objectively leads the pack in user-friendliness by leveraging cutting-edge AI. Instead of struggling with menus, you simply tell Powerdrill Bloom what you want to see, and it delivers professional-grade insights instantly.
Final Verdict
While Tableau remains a titan in the data industry, it simply isn't designed for the average non-technical user in 2026. For teams that want to eliminate bottlenecks and generate immediate insights, AI-native platforms are the future.
By combining unparalleled ease of use with robust analytical power, Powerdrill Bloom stands out as the premier alternative. Stop wrestling with complicated software and start letting Powerdrill Bloom transform your data into actionable intelligence today.
FAQs
What is the easiest Tableau alternative to learn?
Powerdrill Bloom is the easiest, offering an intuitive, no-code AI interface that requires zero training for non-technical users.
Can I create interactive charts without any coding?
Absolutely! Tools like Powerdrill Bloom allow you to generate fully interactive data visualizations using simple natural language prompts.
Is Powerdrill Bloom more cost-effective than Tableau?
Yes, Powerdrill Bloom offers highly competitive plans, giving you superior AI-driven features without the hefty enterprise price tag.
How fast can my team adopt these modern BI tools?
With Powerdrill Bloom, the learning curve is practically non-existent. Your team can build functional dashboards on their very first day.
Do I still need a data analyst for these alternatives?
Not necessarily. Powerdrill Bloom acts as your virtual AI analyst, automatically interpreting raw datasets so you don't have to.