10 Best Power BI and Tableau Alternatives for Smarter Data Analysis in 2026: Tested & Compared

Introduction
Business intelligence (BI) is no longer restricted to isolated data teams managing complex semantic layers or running heavy SQL queries. Modern organizations demand agility, pushing toward true data democratization where every stakeholder can extract actionable insights instantly.
While legacy giants like Power BI and Tableau have dominated the analytics landscape for years, their steep learning curves and rigid architectures can bottleneck fast-paced decision-making.
Today, a new wave of AI-native platforms and streamlined BI tools has emerged, offering smarter, faster, and more intuitive data analysis. In this comprehensive guide, we test and compare the top alternatives to help you find the perfect analytics engine for your evolving tech stack.
Why Are More Teams Looking Beyond Power BI and Tableau
Despite their robust capabilities, traditional BI tools are not always the best fit for modern, agile teams. Here is why users are seeking alternatives:
Steep Learning Curves: Mastering proprietary languages like Power BI’s DAX or Tableau’s complex calculated fields requires extensive training.
High Total Cost of Ownership: Enterprise licensing, combined with the need for dedicated IT support, inflates operational costs.
Sluggish Ad-Hoc Analysis: Real-time data querying can be cumbersome when tied to heavy, legacy desktop-first architectures.
Lack of Native AI Storytelling: While they feature basic AI, they often fail to autonomously translate raw data into cohesive, narrative-driven presentations.
IT Bottlenecks: Heavy reliance on data engineers to build dashboards slows down business users who need immediate answers.
How Did We Test These Power BI and Tableau Alternatives
To identify the best tools for smarter data analysis, we evaluated these platforms based on rigorous criteria:
Time-to-Insight: How fast a non-technical user can upload a dataset and generate a meaningful visualization.
AI and Automation: The effectiveness of built-in generative AI for querying data and suggesting analytical trends.
Data Connectivity: Seamless integration with modern cloud data warehouses (e.g., Snowflake, BigQuery) and simple CSV/Excel uploads.
Collaboration Features: The ability to easily share insights, embed charts, and collaborate across teams.
Pricing Scalability: Transparent pricing models that offer high value without hidden enterprise fees.
Quick Comparison: Best Power BI and Tableau Alternatives at a Glance
Tool | Best For | Starting Price |
AI-Driven Analytics & Presentation | ||
Search-Driven BI for Enterprise | ||
Complex Data Blending | Custom Pricing | |
Spreadsheet-Like Cloud BI | Custom Pricing | |
Collaborative Data Science Teams | ||
End-to-End Business Dashboards | Custom Pricing | |
SQL & Python Pro Analysts | Custom Pricing | |
Open-Source & Quick Querying | ||
Conversational Data Analysis | ||
Quick Data Report Presentations |
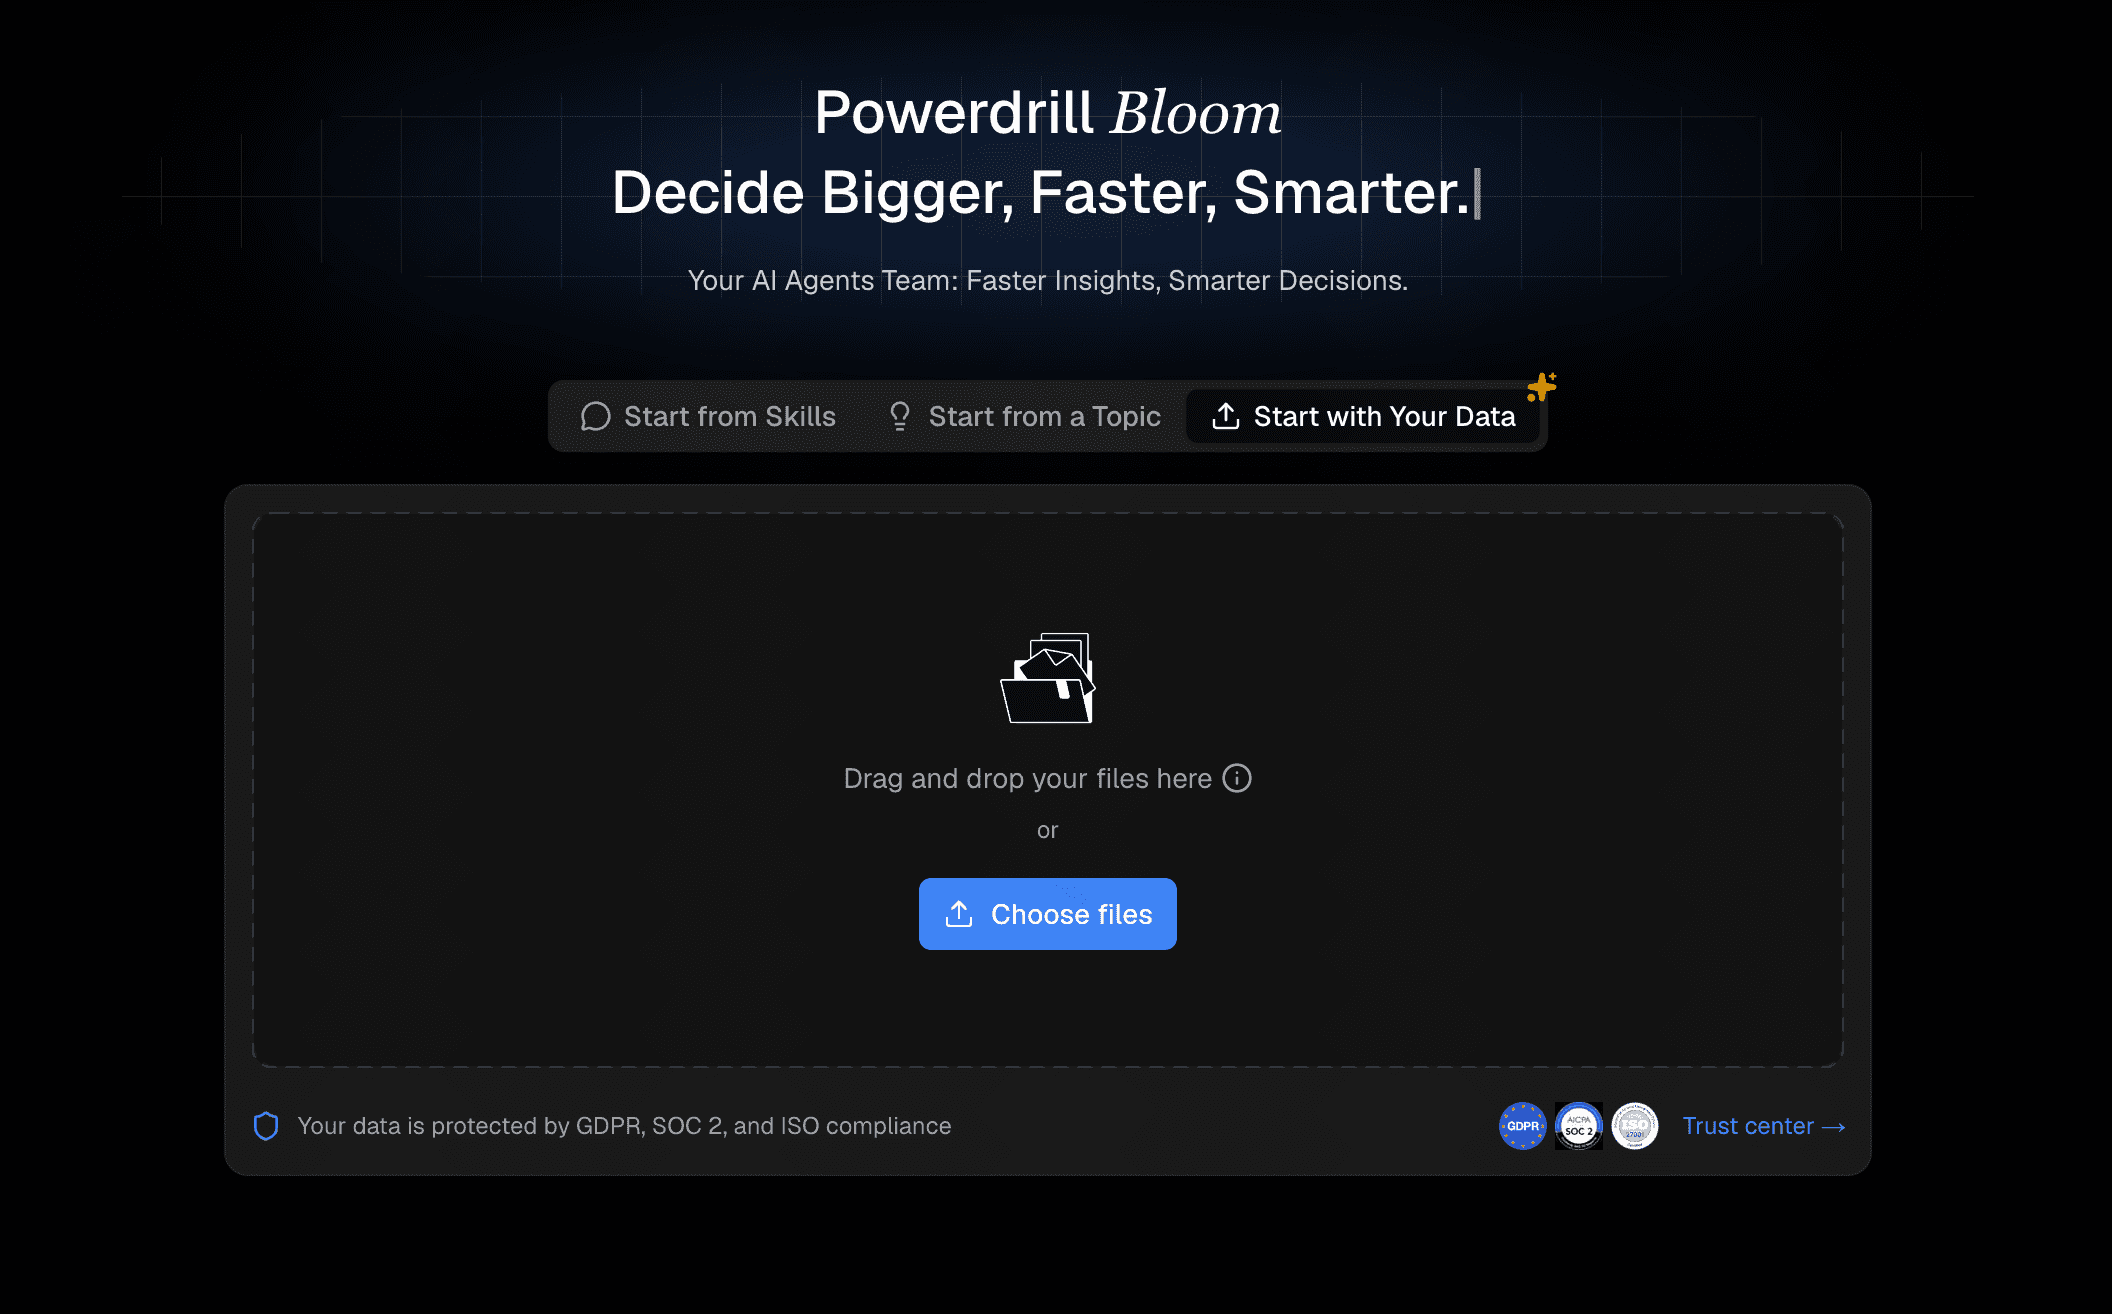
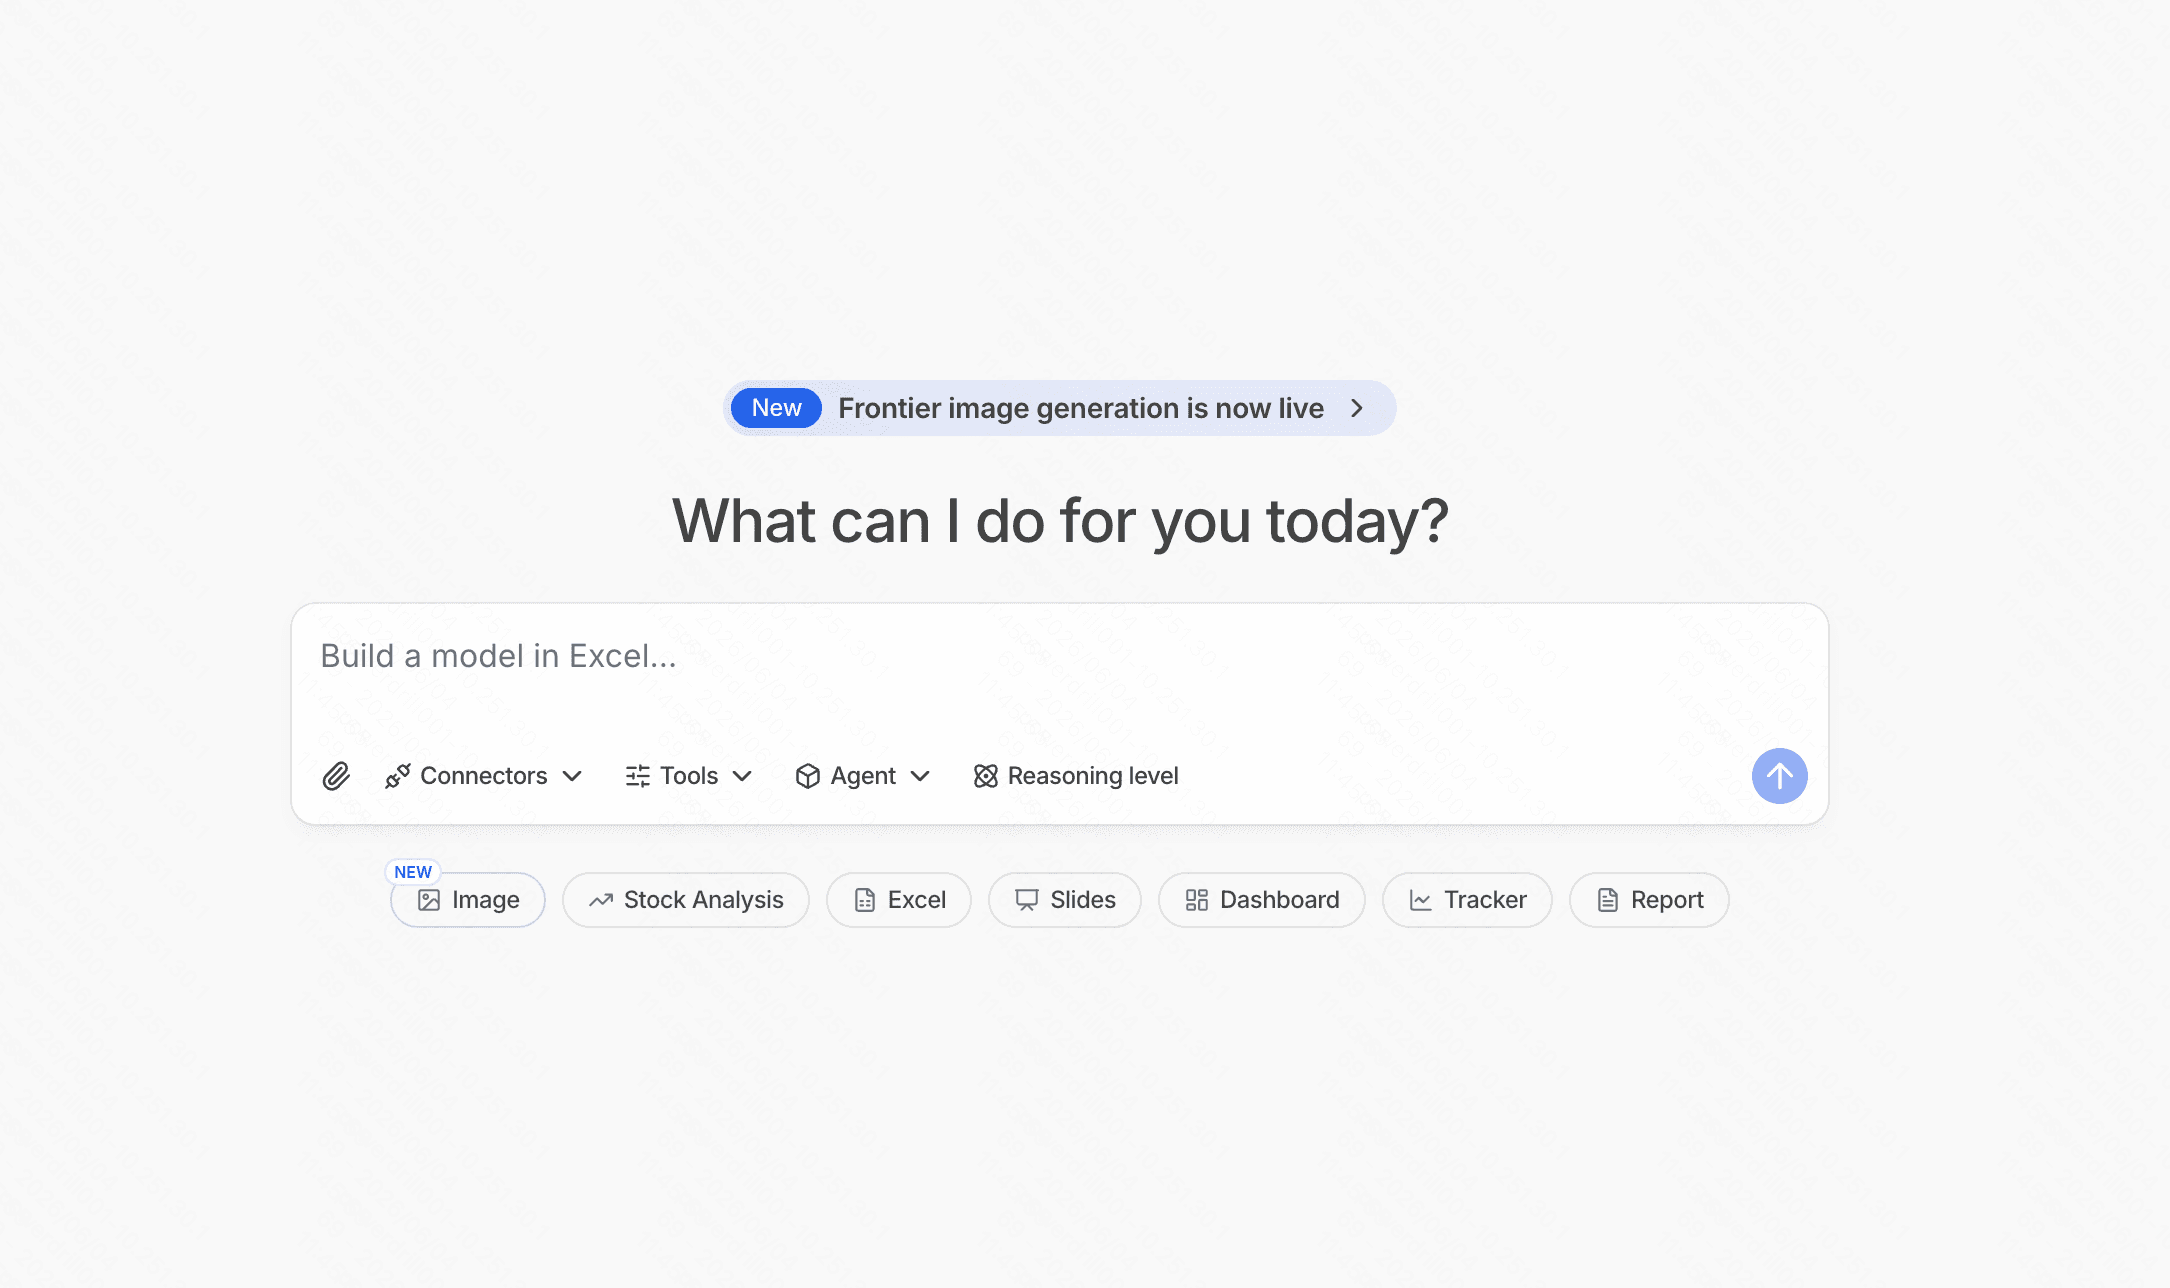
1. Powerdrill Bloom
Powerdrill Bloom revolutionizes how teams approach smarter data analysis by seamlessly merging robust data parsing with AI-generated visual storytelling. It eliminates the friction between analyzing a spreadsheet and presenting the findings to stakeholders.
Key Features
Instant AI conversion of raw datasets into highly visual, narrative-driven slide decks.
Intelligent, automated chart selection based on contextual data analysis.
Real-time conversational interface to query data and adjust visualizations.
Pros
Bridges the gap between data analytics and presentation design perfectly.
Zero learning curve for non-technical business users.
Accelerates reporting workflows by hours.
Cons
Lacks the deep predictive modeling features of dedicated data science platforms.
Requires internet connectivity for its cloud-based AI engine.
Pricing
Freemium model available; Pro features start at a highly competitive $13.27/month.
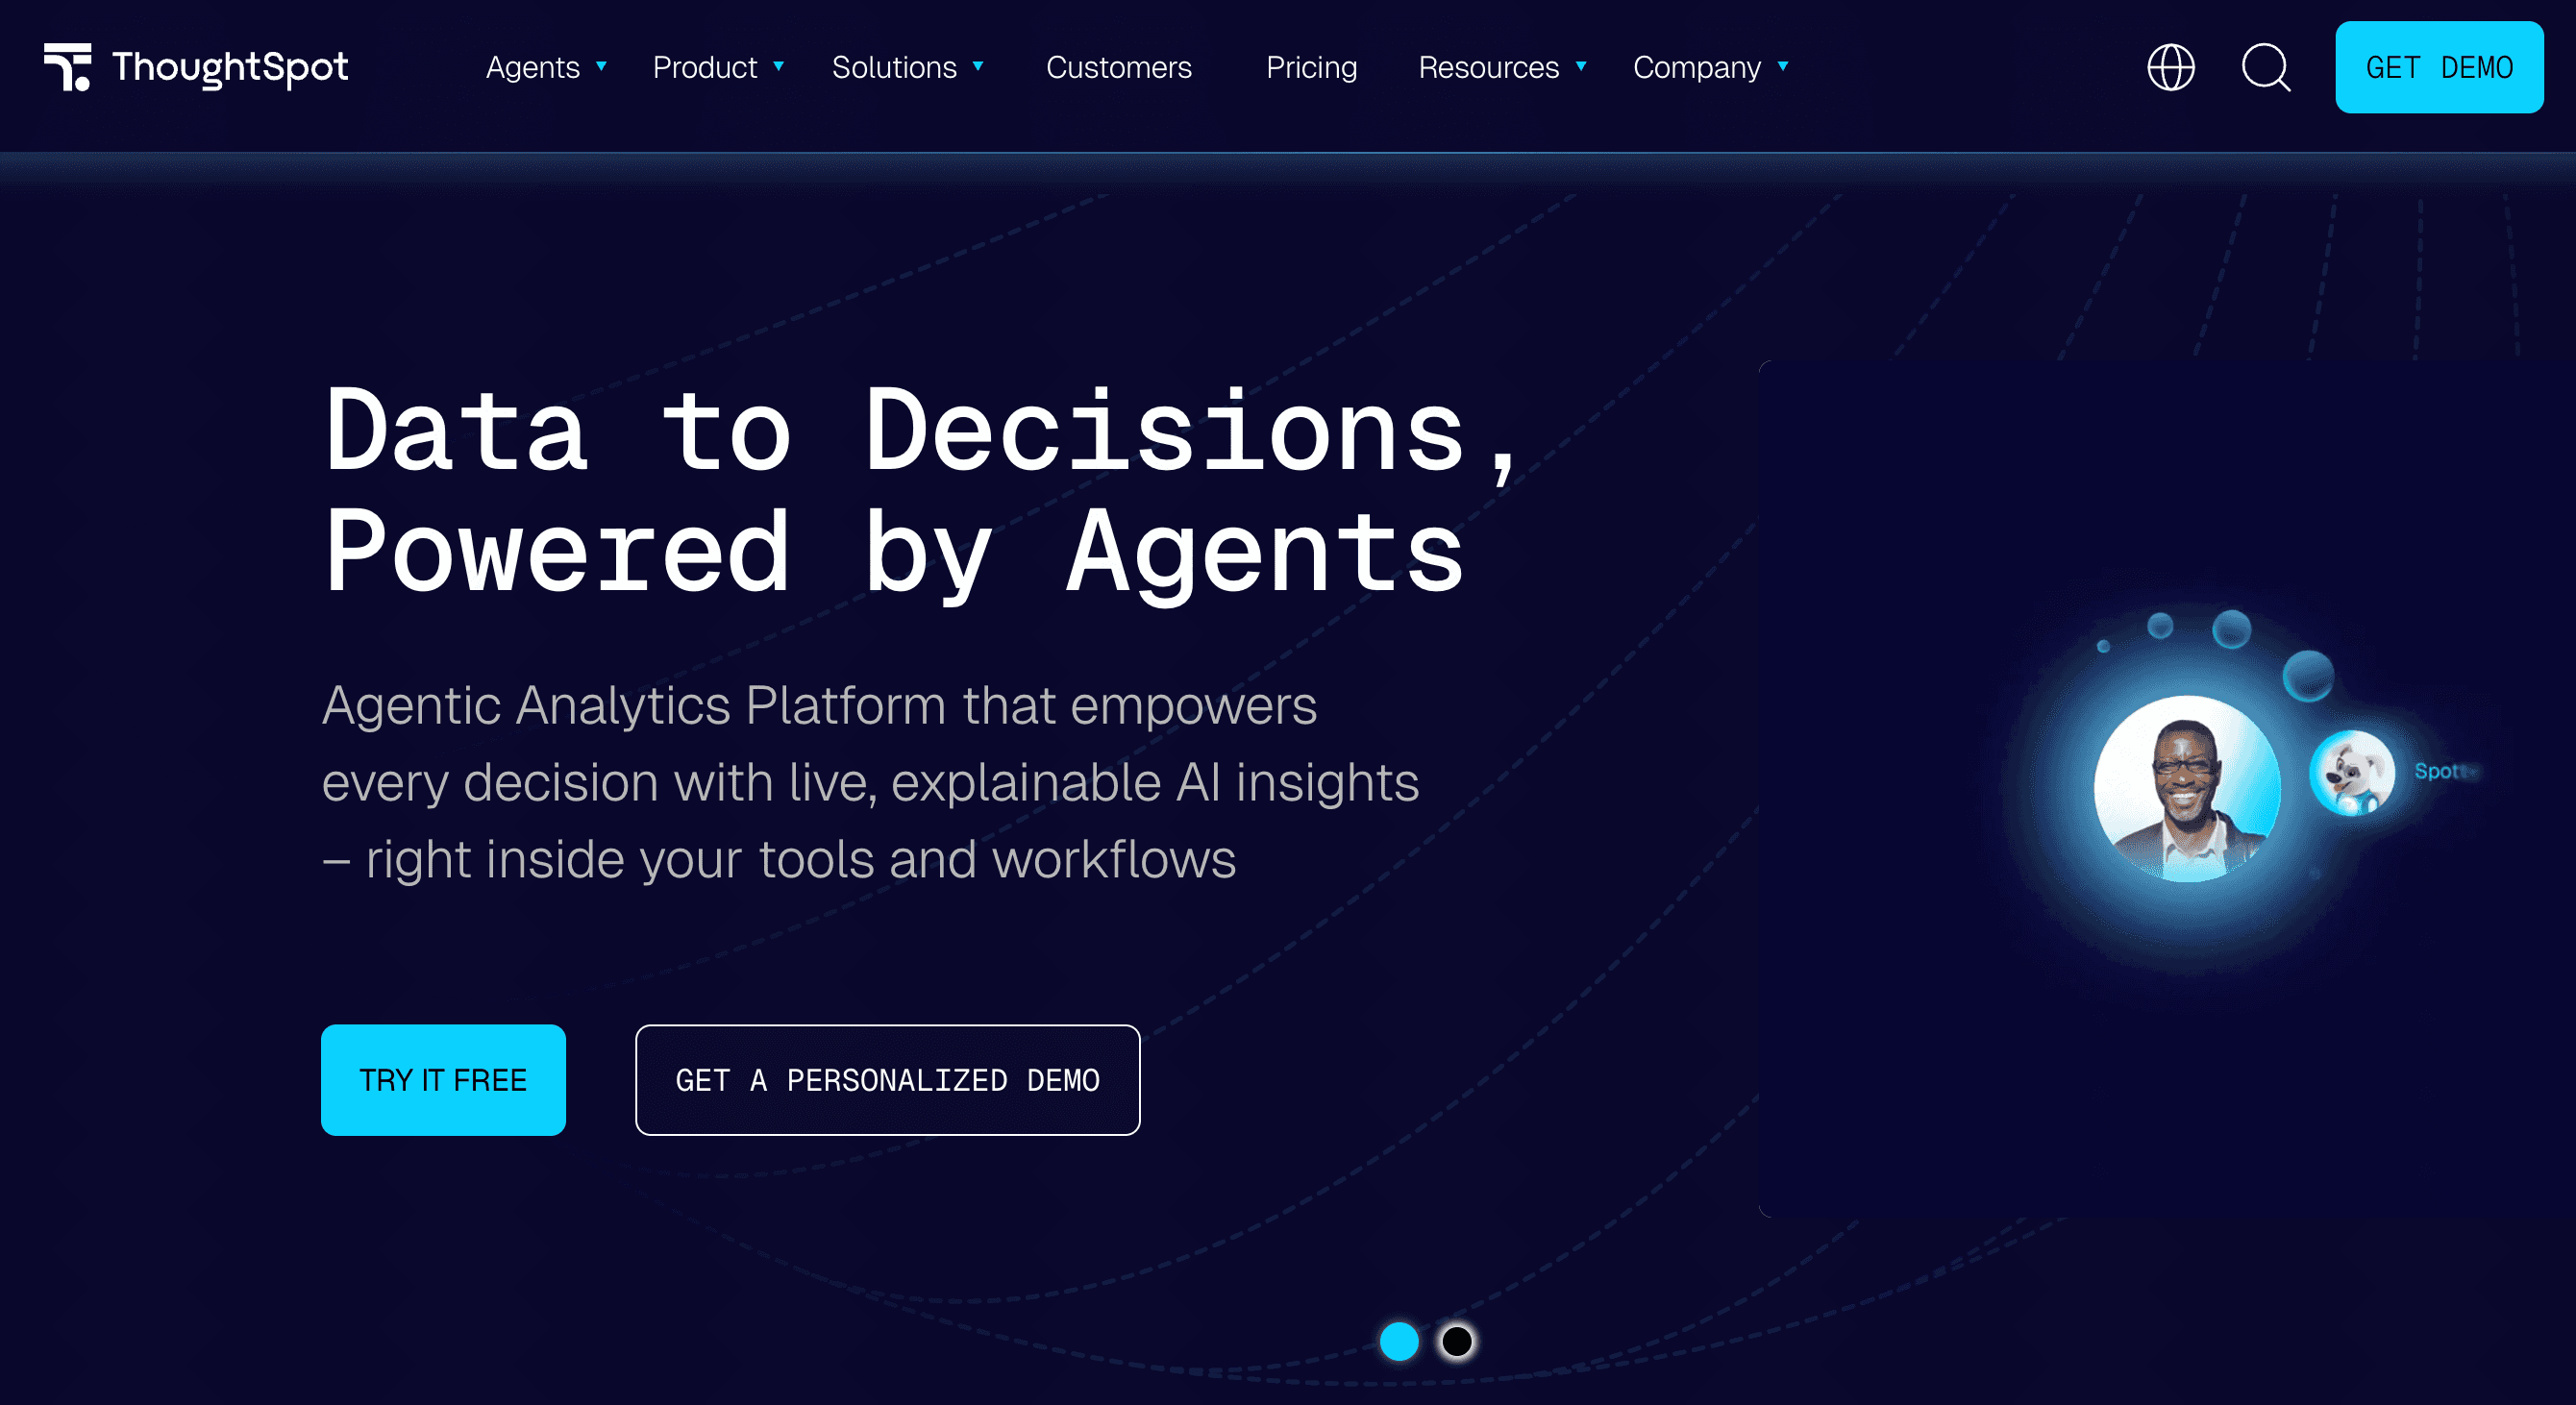
2. ThoughtSpot
ThoughtSpot is a search and AI-driven analytics platform designed to let anyone analyze enterprise data as easily as searching on Google, making it a powerhouse for self-service BI.
Key Features
Natural Language Processing (NLP) search bar for immediate query answers.
AI-powered "SpotIQ" that uncovers hidden anomalies and trends.
Direct querying on cloud data warehouses without data extraction.
Pros
Empowers non-technical users to build their own dashboards.
Highly scalable for massive enterprise datasets.
Excellent mobile app for insights on the go.
Cons
High starting price makes it inaccessible for small businesses.
Requires a well-structured underlying data warehouse to function optimally.
Pricing
Team plans start at $50/per user month.
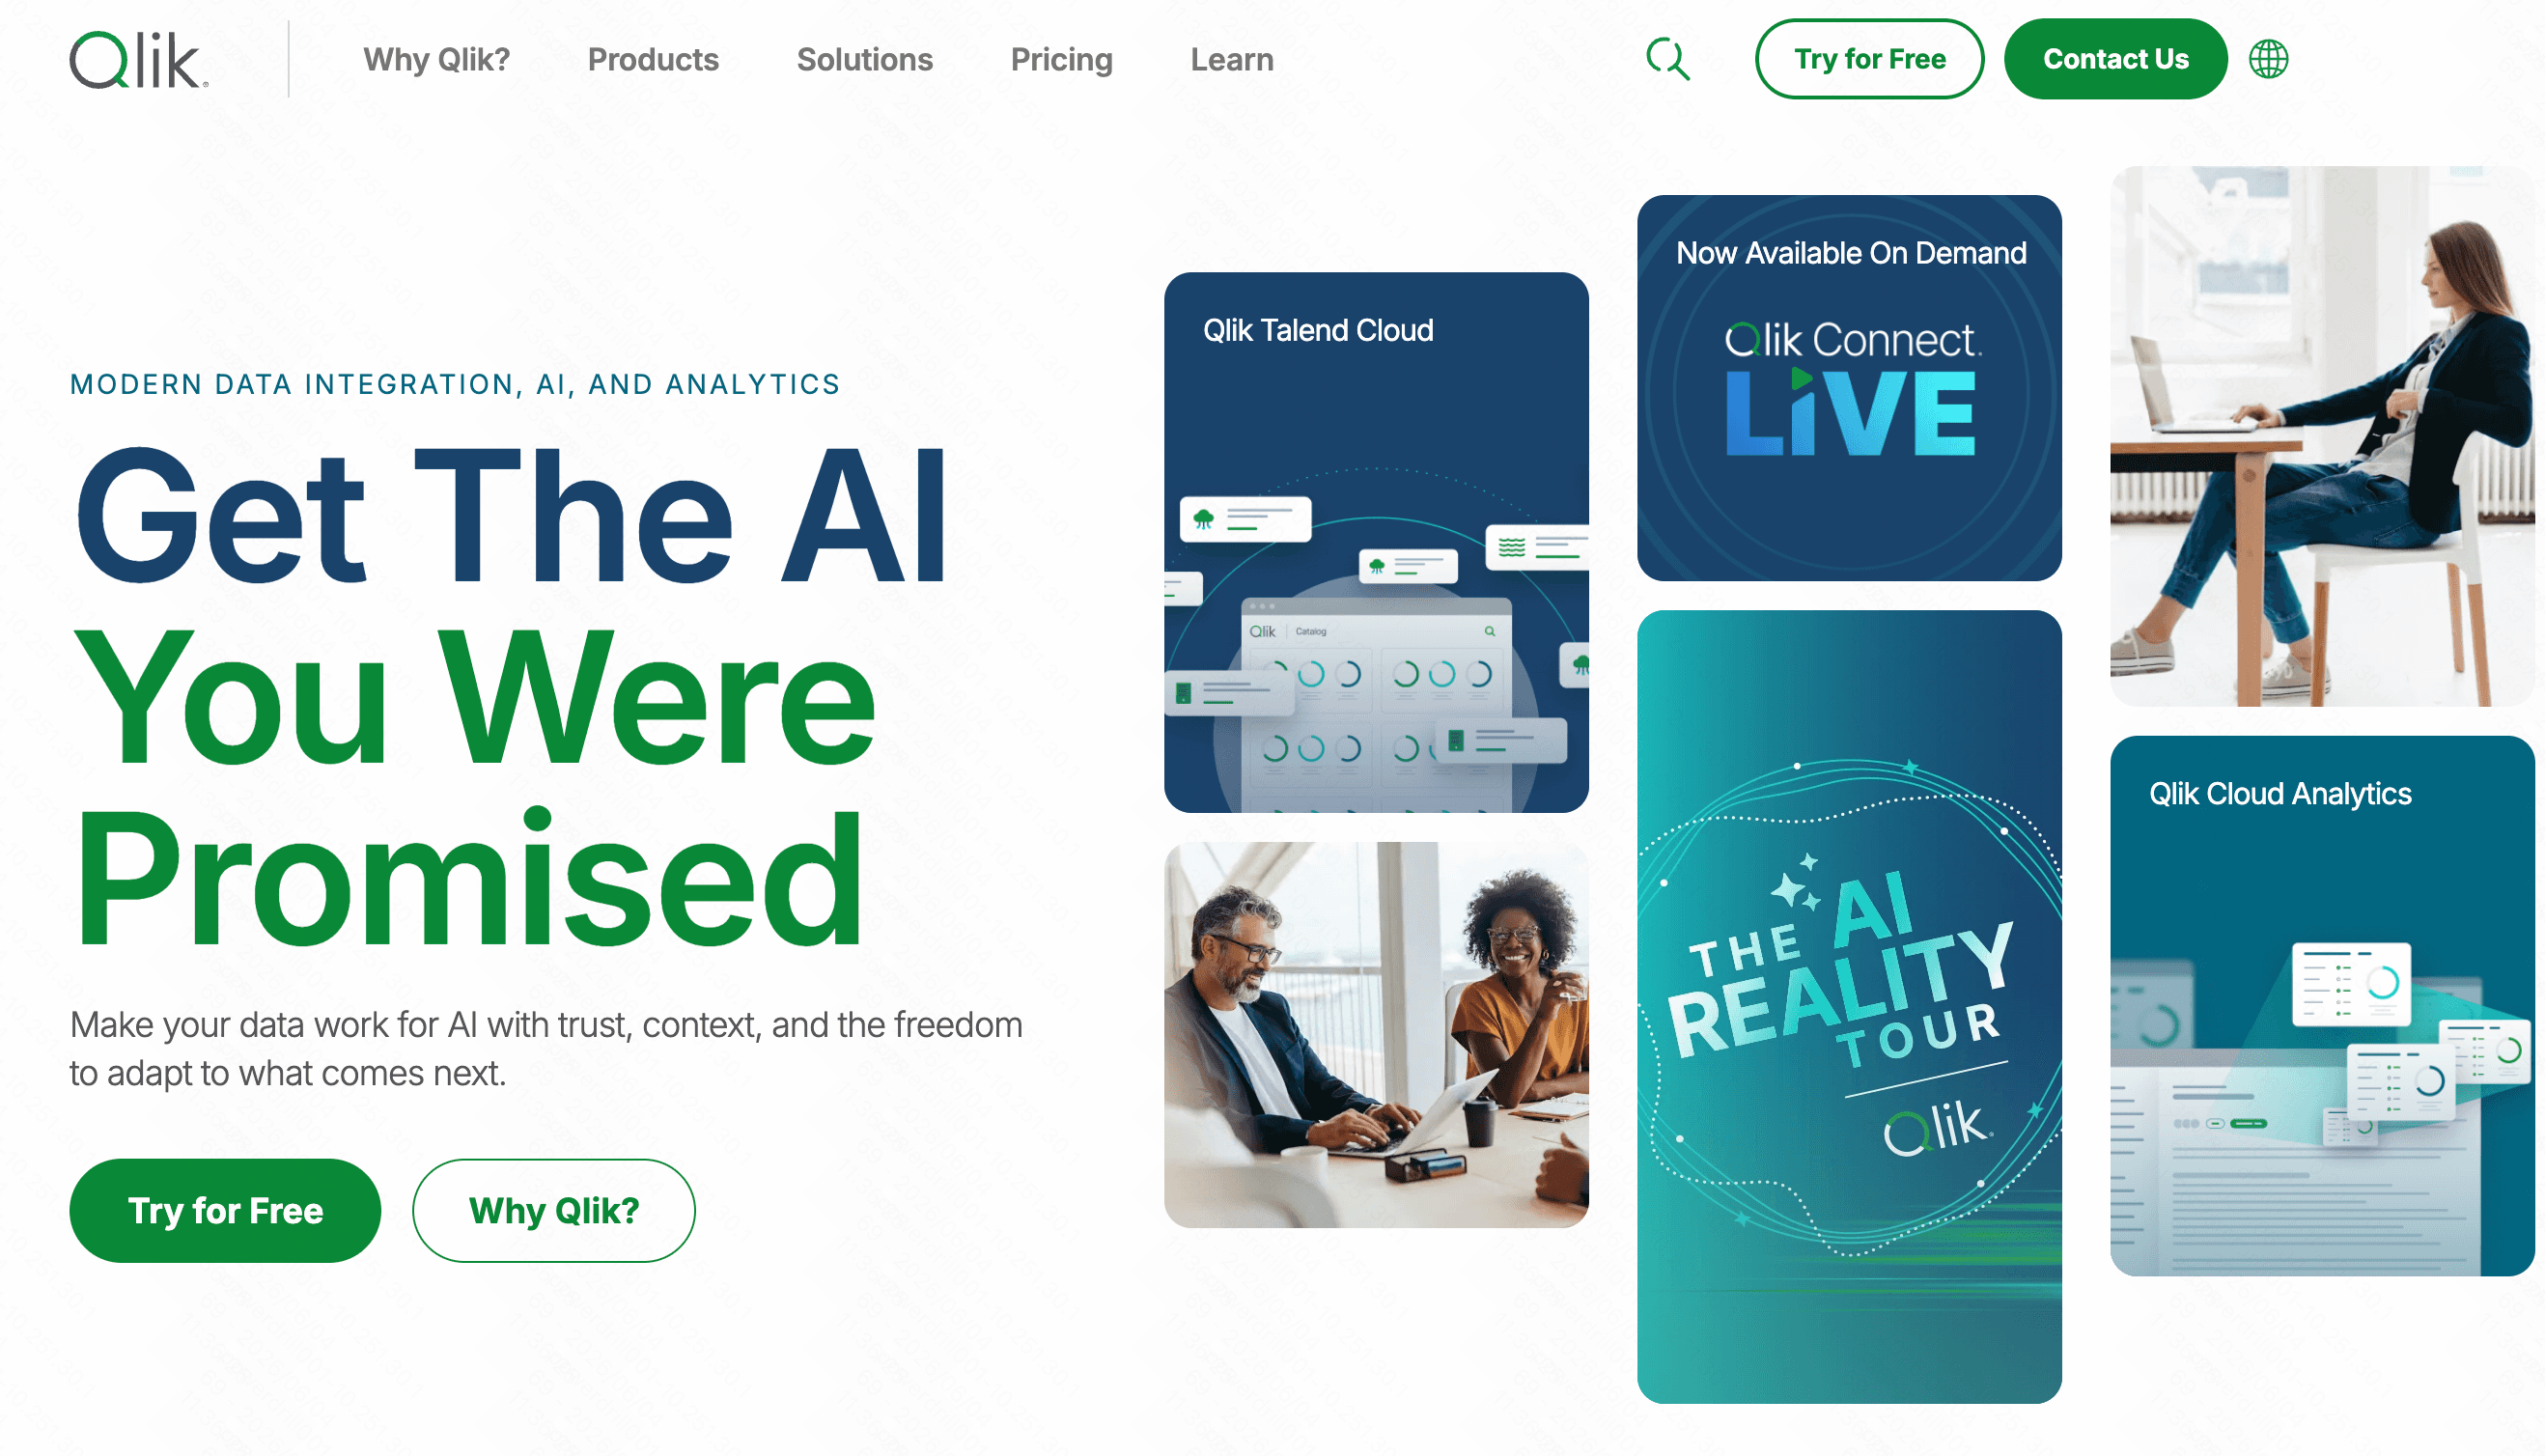
3. Qlik Sense
Qlik Sense uses a unique Associative Engine that maps relationships across all data sources. It allows users to explore data freely in any direction, unlike traditional linear, query-based BI tools.
Key Features
Associative data engine for exploring hidden data relationships.
Strong augmented analytics and automated insight generation.
Robust hybrid and multi-cloud deployment options.
Pros
Incredible flexibility in data exploration without predefined queries.
Handles complex data blending from multiple disparate sources well.
Strong offline capabilities.
Cons
The interface is slightly outdated compared to modern cloud startups.
Custom scripting language requires some training.
Pricing
Custom Pricing.
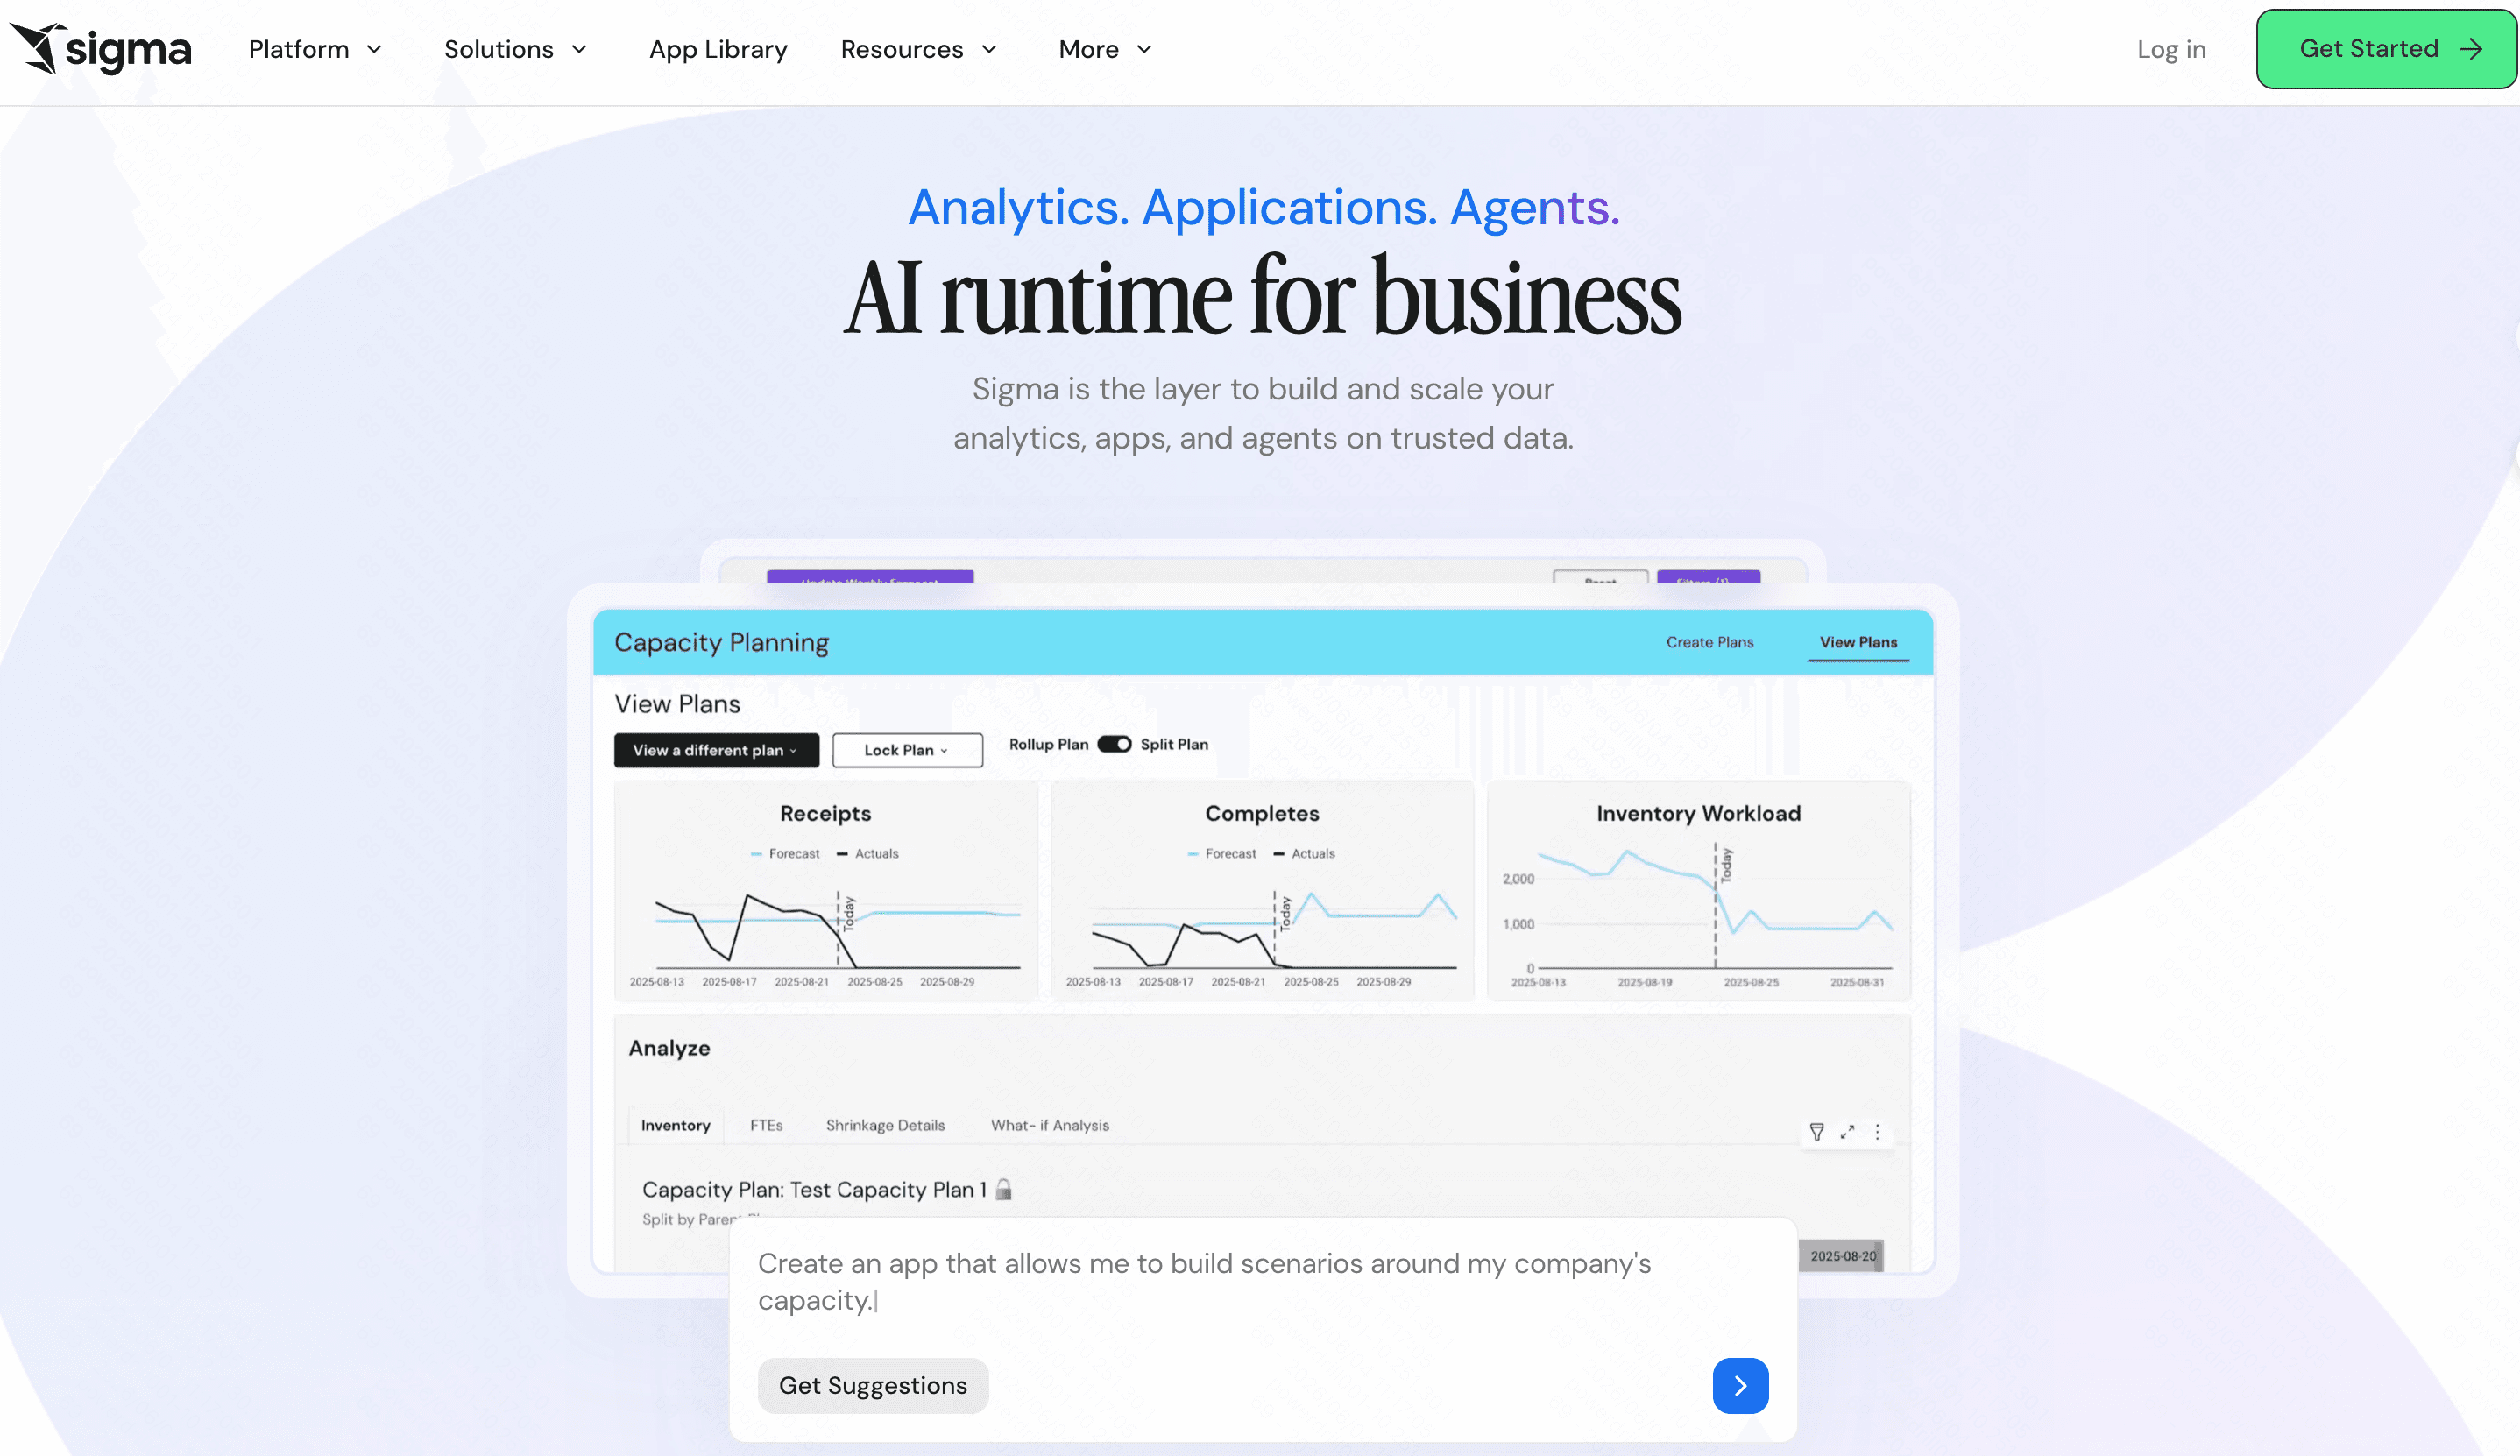
4. Sigma
Sigma brings the familiar interface of a spreadsheet to the massive scale of a cloud data warehouse. It allows business teams to analyze billions of rows of data using familiar Excel-like formulas.
Key Features
Familiar spreadsheet user interface for cloud data querying.
Direct, live connection to Snowflake, BigQuery, and Redshift.
Collaborative, real-time multiplayer editing.
Pros
No SQL knowledge required to perform deep data analysis.
Eliminates data extraction, keeping governance secure in the cloud.
Very high user adoption rate due to the spreadsheet familiarity.
Cons
Only works well if you already use a cloud data warehouse.
Lacks traditional, standalone file-upload analytics (like raw CSV manipulation).
Pricing
Custom enterprise pricing based on usage.
5. Hex
Hex is a modern workspace for data science and analytics teams. It combines SQL, Python, and R in collaborative notebook interfaces that instantly turn into interactive data apps for business users.
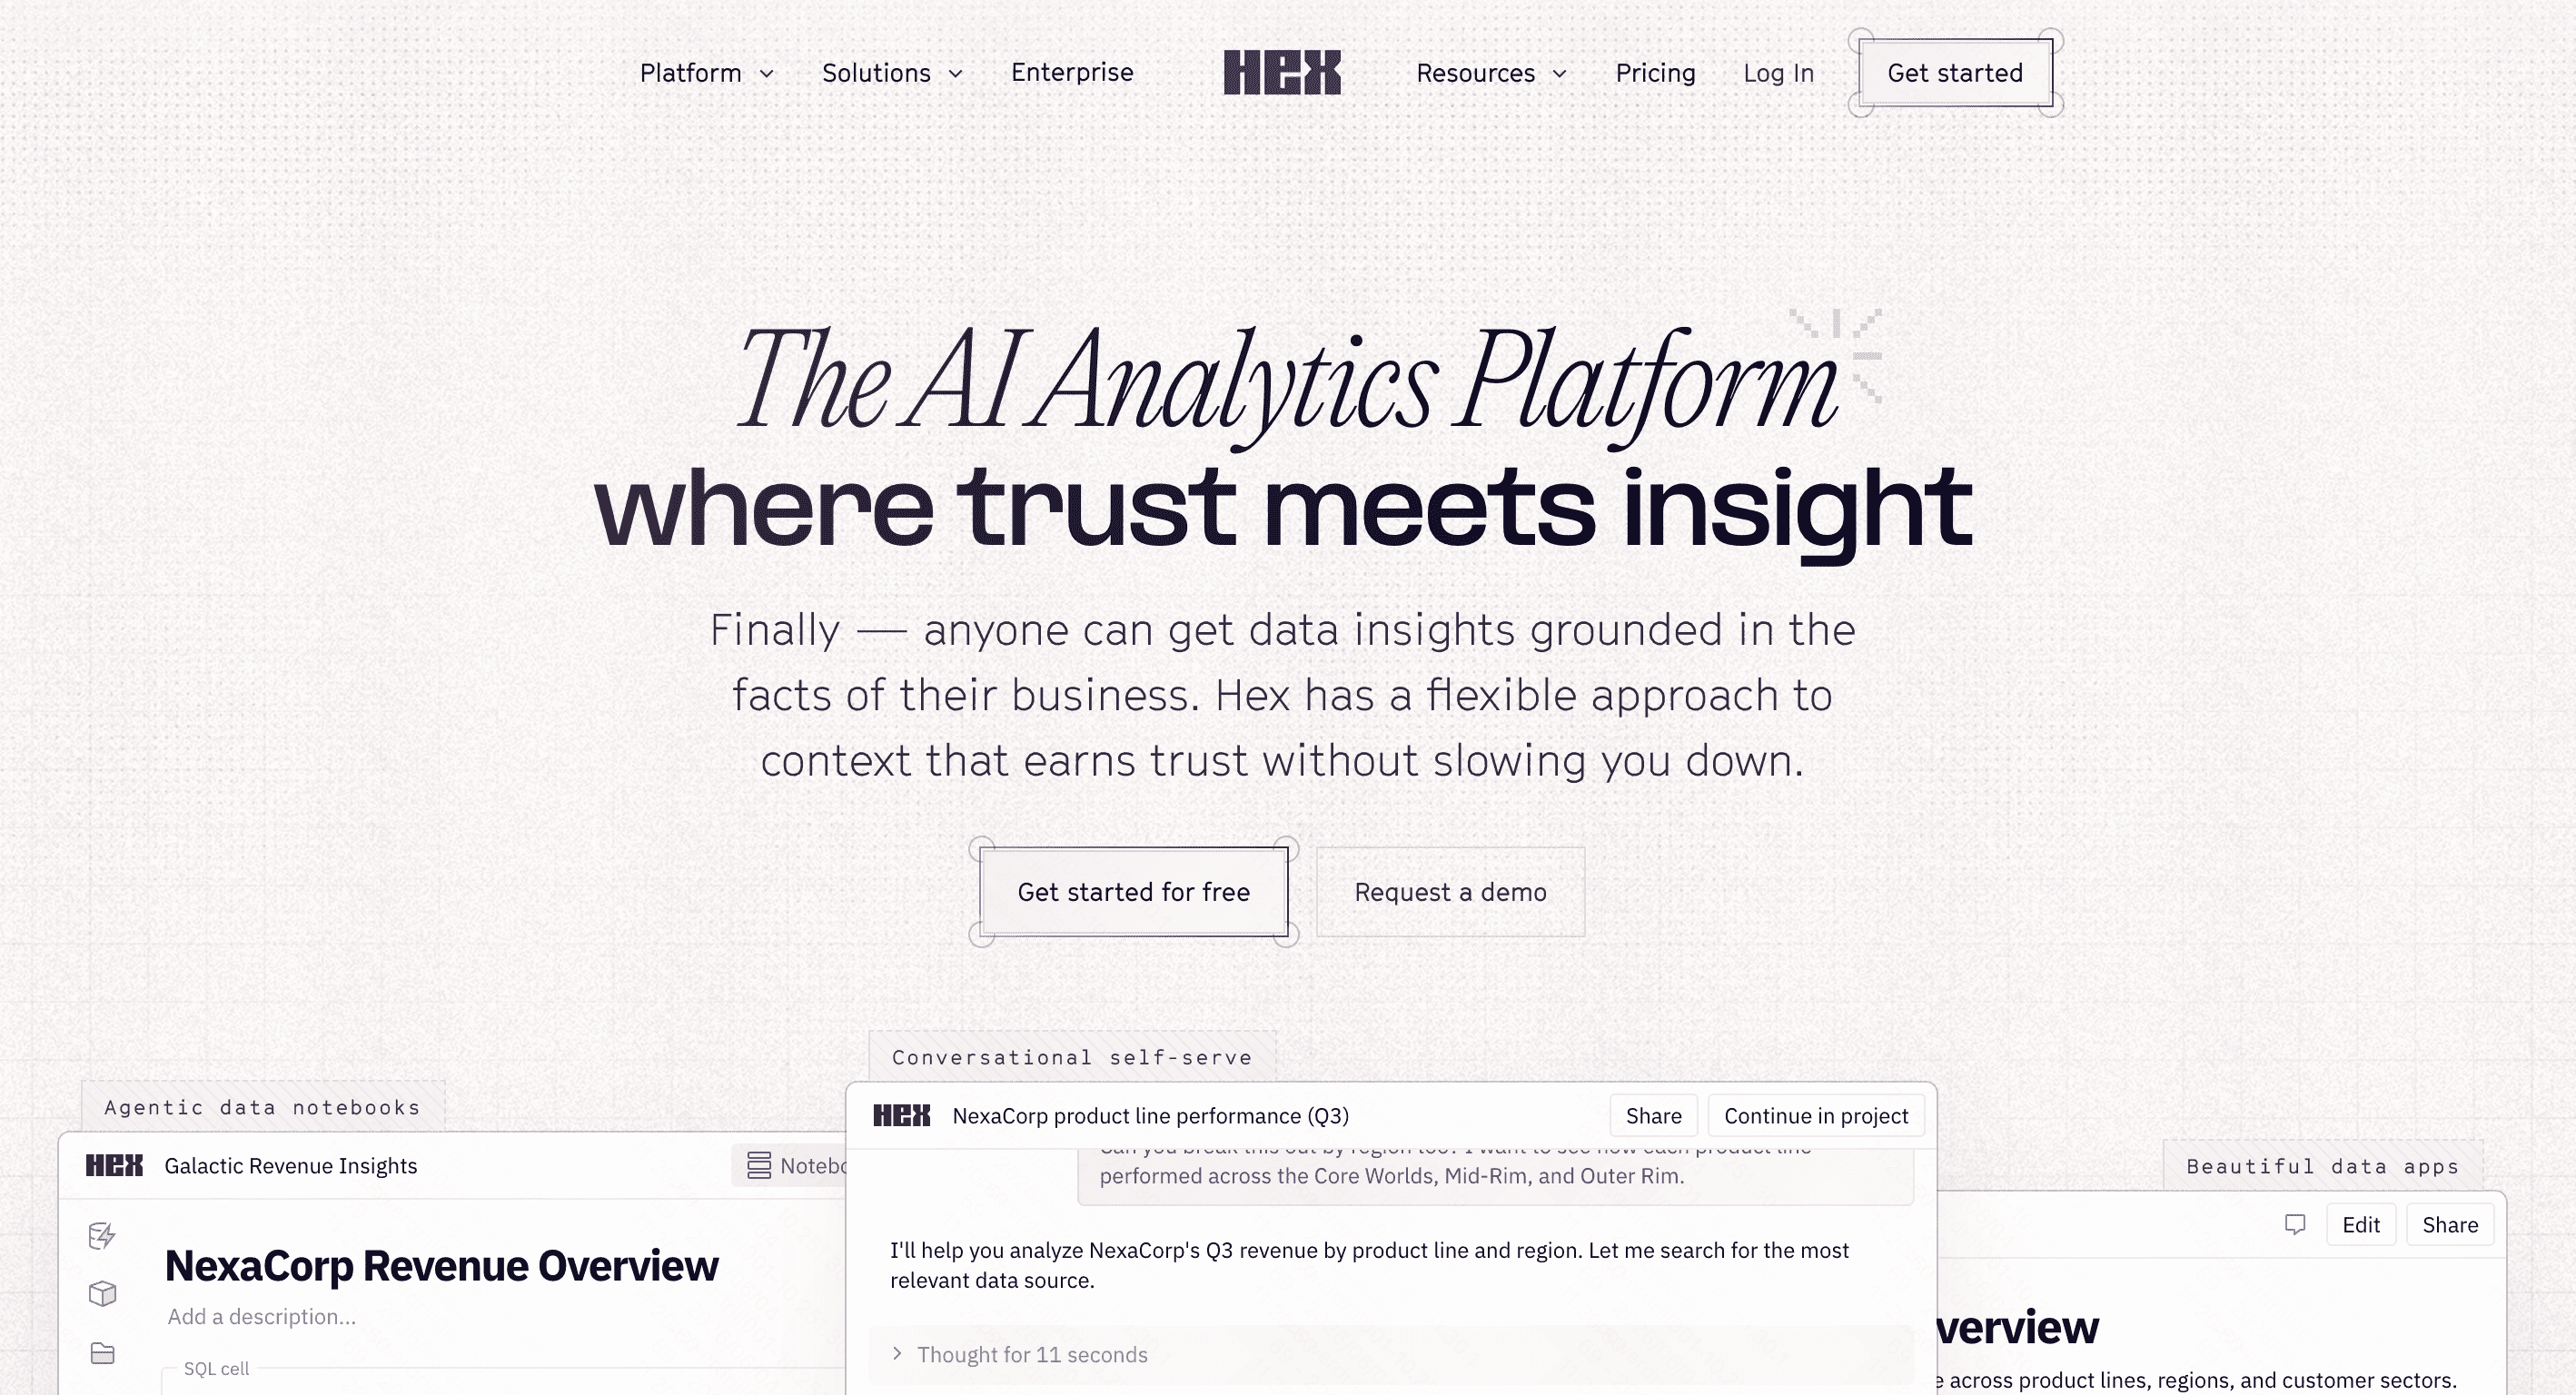
Key Features
Polyglot notebooks supporting SQL, Python, and no-code in one UI.
One-click publishing from data notebook to interactive dashboard.
Real-time collaboration similar to Google Docs.
Pros
Incredible synergy for technical analysts and business stakeholders.
Highly customizable data apps.
Streamlines the data science workflow drastically.
Cons
Not suited for entirely non-technical users looking for simple plug-and-play BI.
Requires knowledge of SQL or Python for maximum utility.
Pricing
Free tier available; Pro plan starts at $36/month/user.
6. Domo
Domo is a comprehensive cloud-based business management platform. It integrates data from virtually any source, providing real-time executive dashboards to drive smarter, company-wide data analysis.
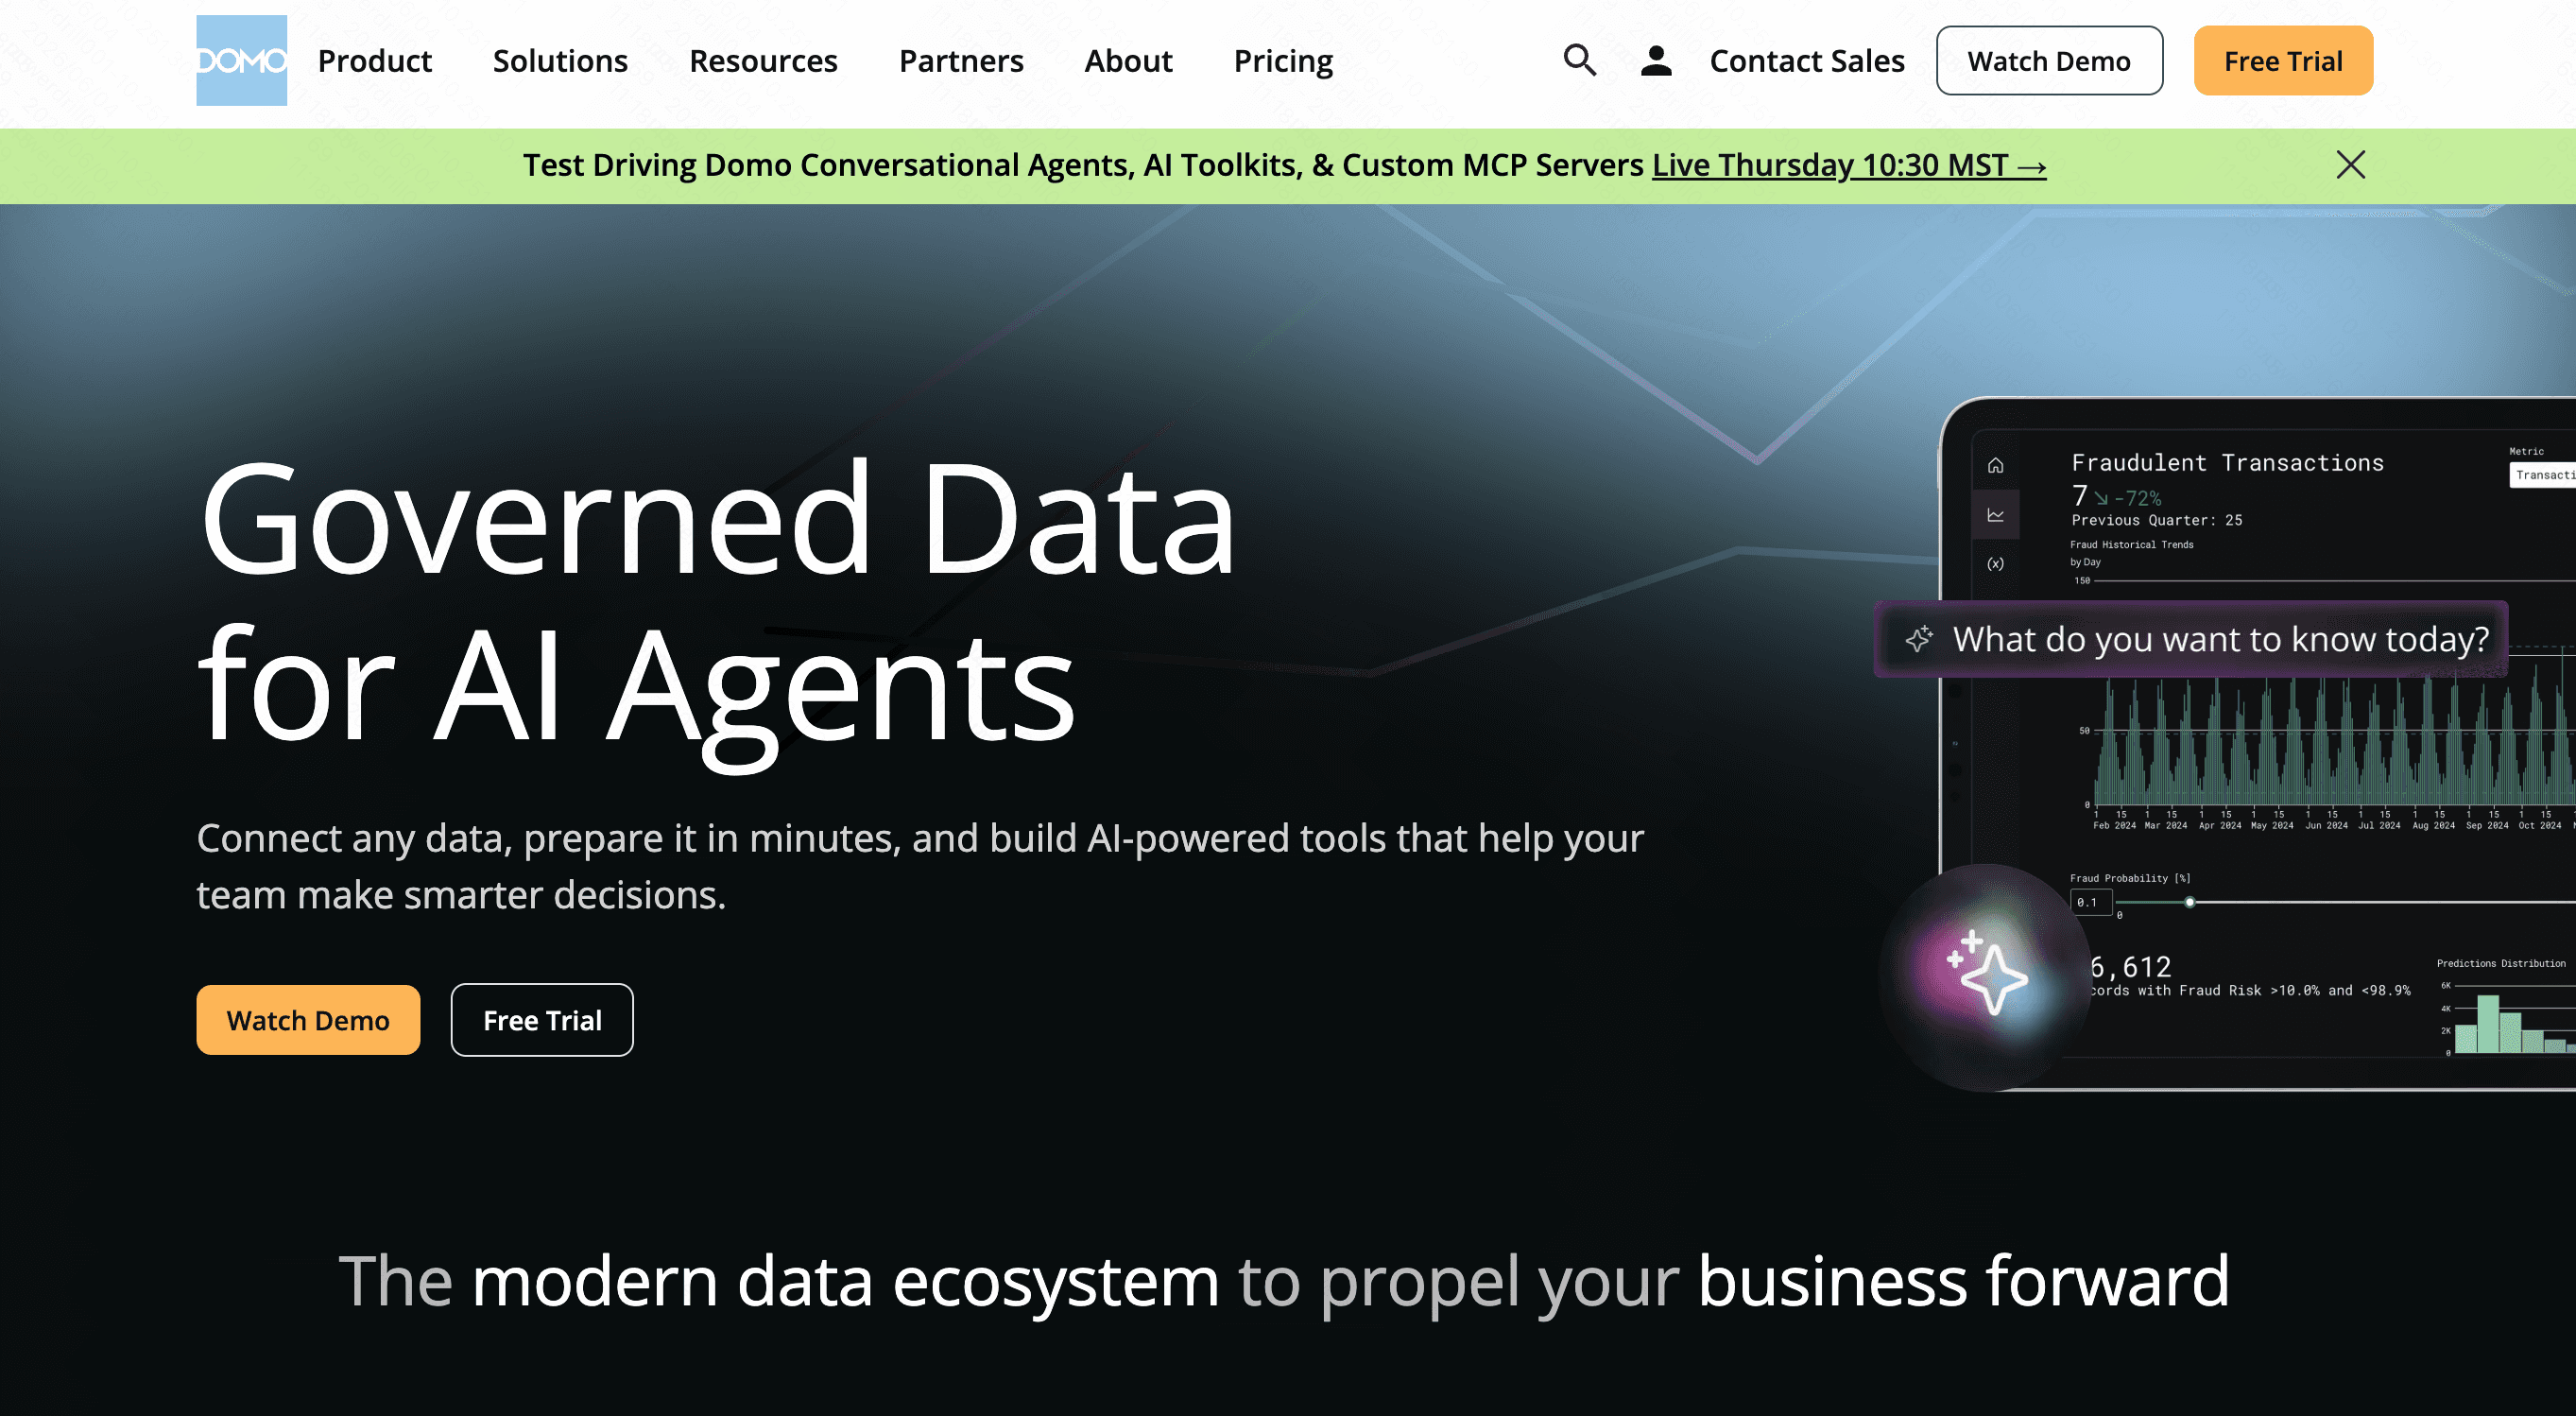
Key Features
Over 1,000 pre-built data connectors (APIs, databases, flat files).
Real-time alerting and mobile-first dashboard access.
Integrated ETL (Extract, Transform, Load) capabilities.
Pros
Fantastic out-of-the-box connectivity for marketing and sales tools.
Strong focus on executive-level, real-time KPI tracking.
Highly visual and interactive user interface.
Cons
Can be excessively expensive for mid-market companies.
The sheer breadth of features can overwhelm new users.
Pricing
Custom pricing.
7. Mode
Mode is a collaborative data platform designed primarily for analysts. It bridges the gap between deep, code-based data exploration and the creation of highly visual, easily consumable business dashboards.
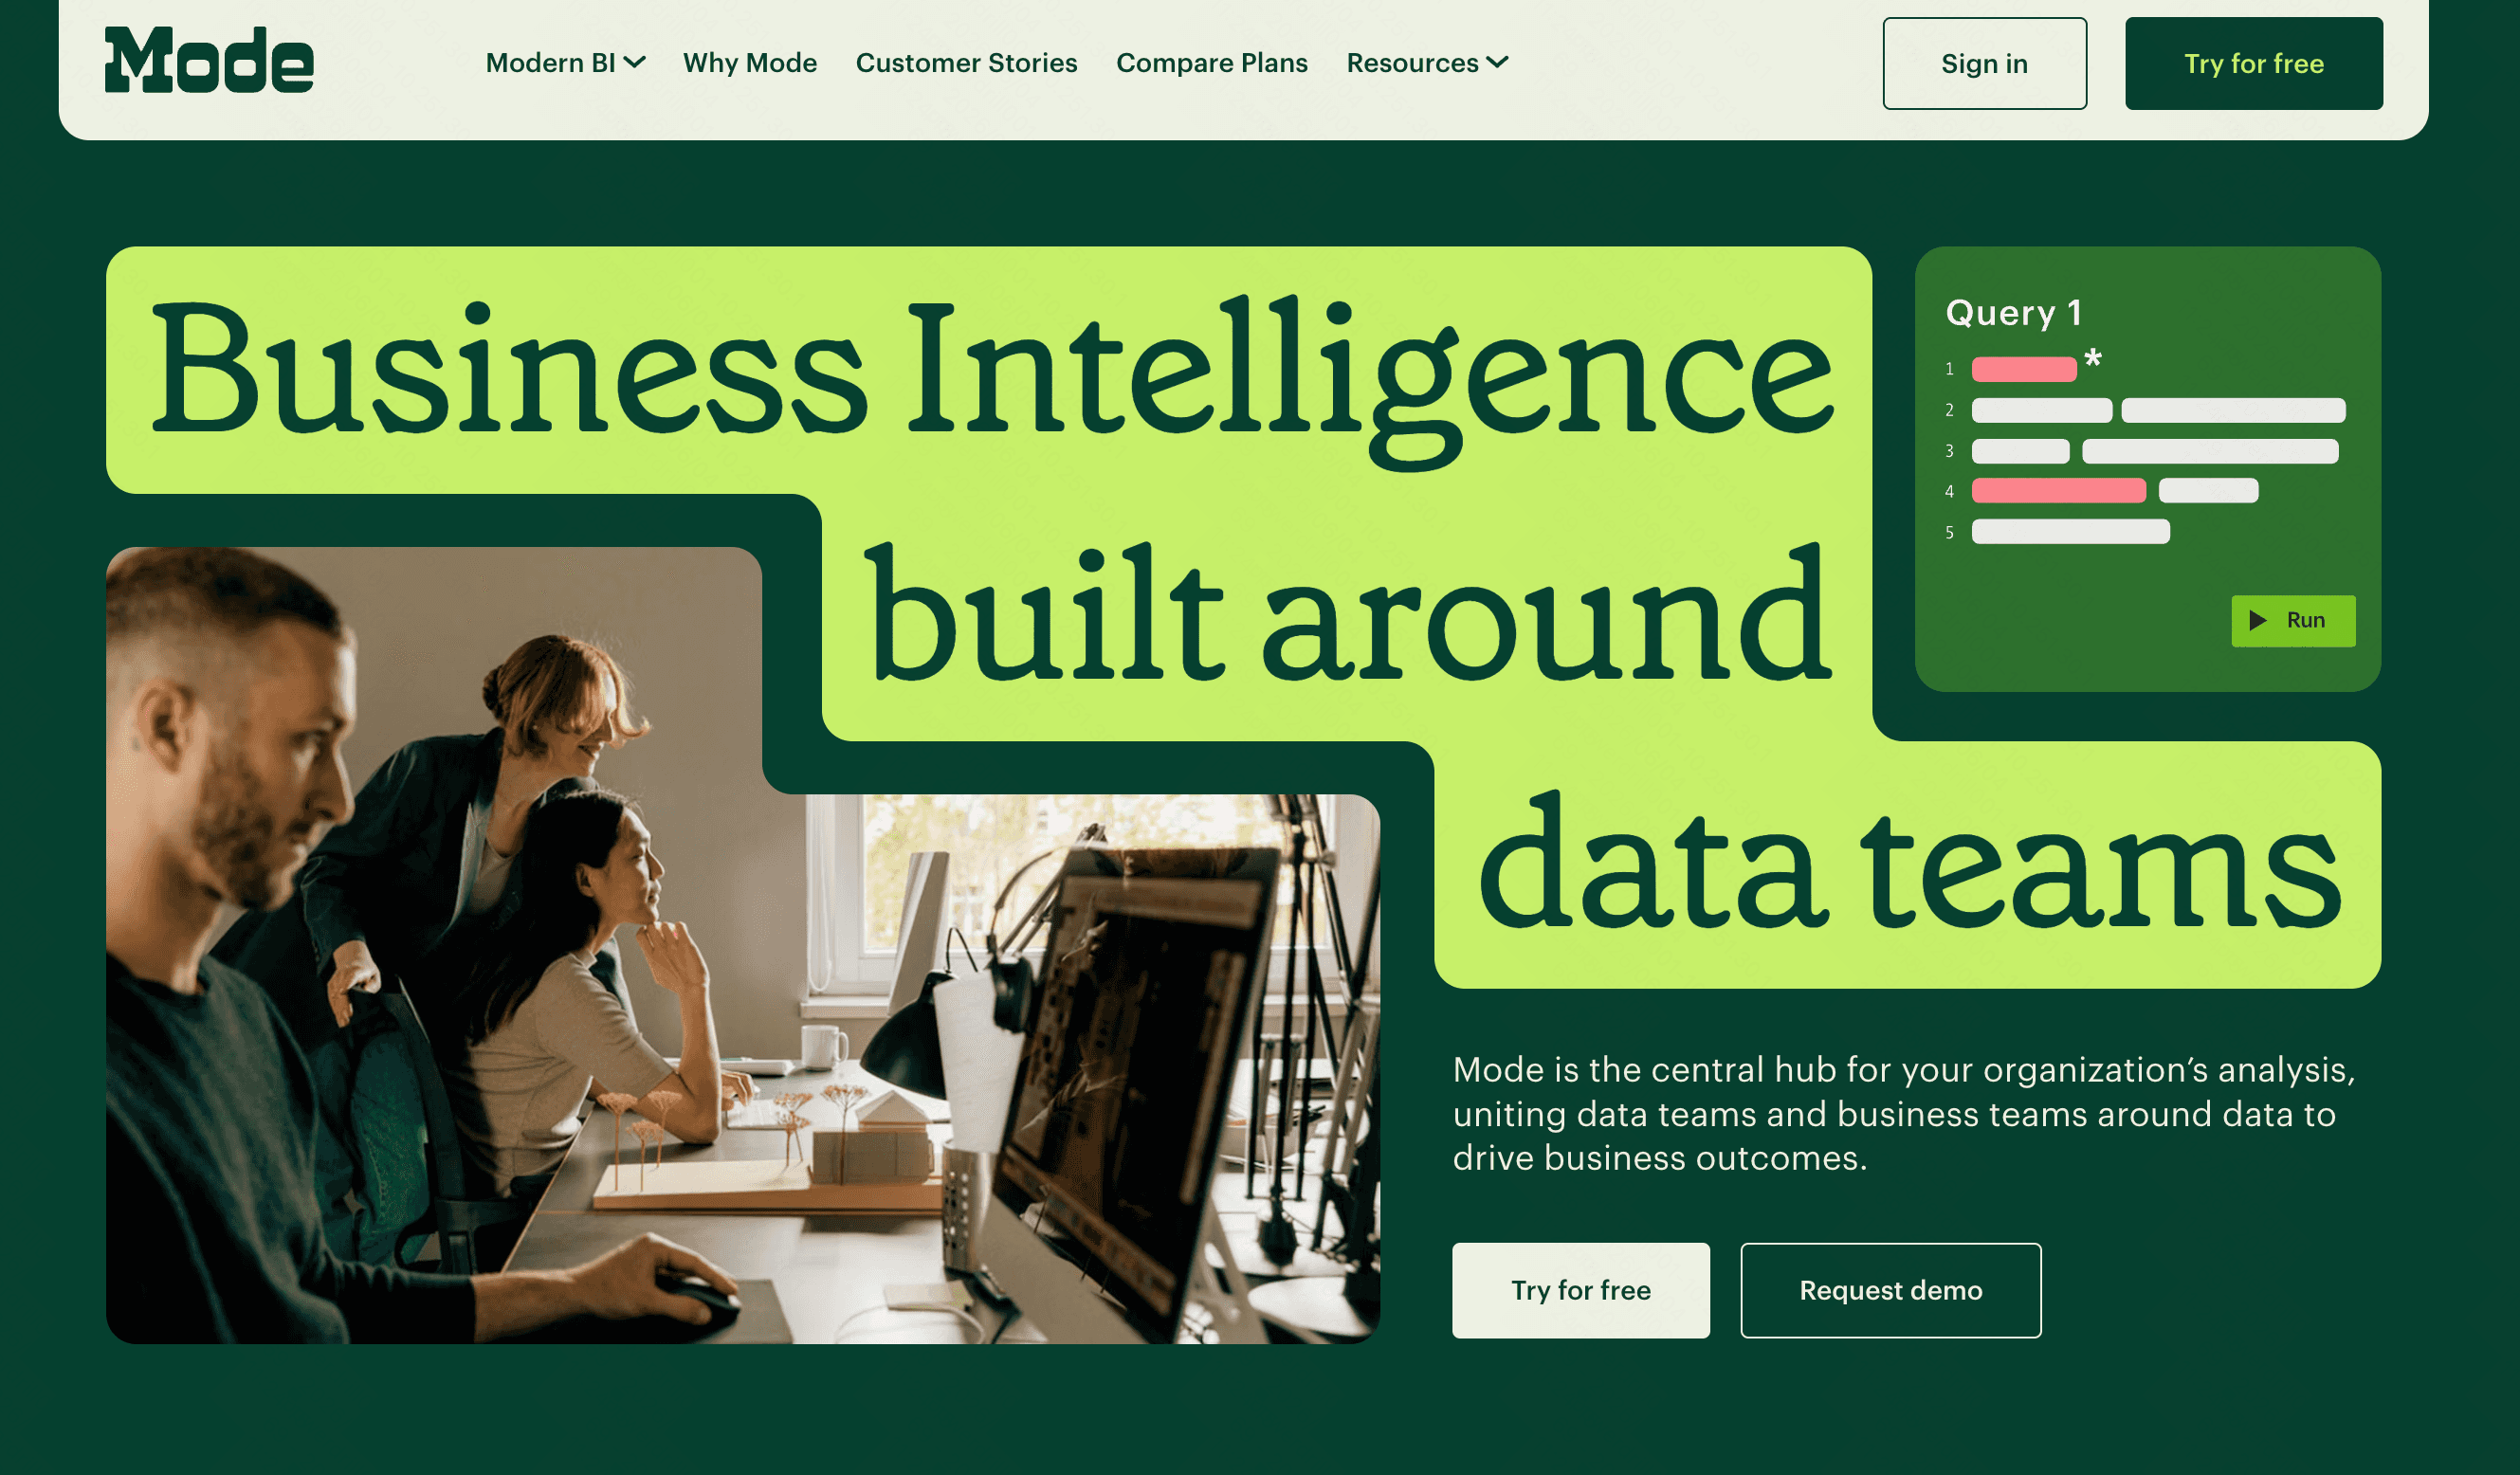
Key Features
Integrated SQL editor and Python/R notebooks.
Helix data engine for fast, in-memory filtering and charting.
Custom, white-label reporting.
Pros
Loved by data analysts for its robust coding environment.
Extremely fast rendering of visualizations on large datasets.
Great version control integration (GitHub).
Cons
Heavily relies on SQL; business users cannot easily build from scratch.
Less focus on automated, AI-driven insights compared to competitors.
Pricing
Custom pricing (typically targets enterprise teams).
8. Metabase
Metabase is an incredibly popular, open-source BI tool that prides itself on simplicity. It lets anyone in the company ask questions and learn from data without needing to know SQL.
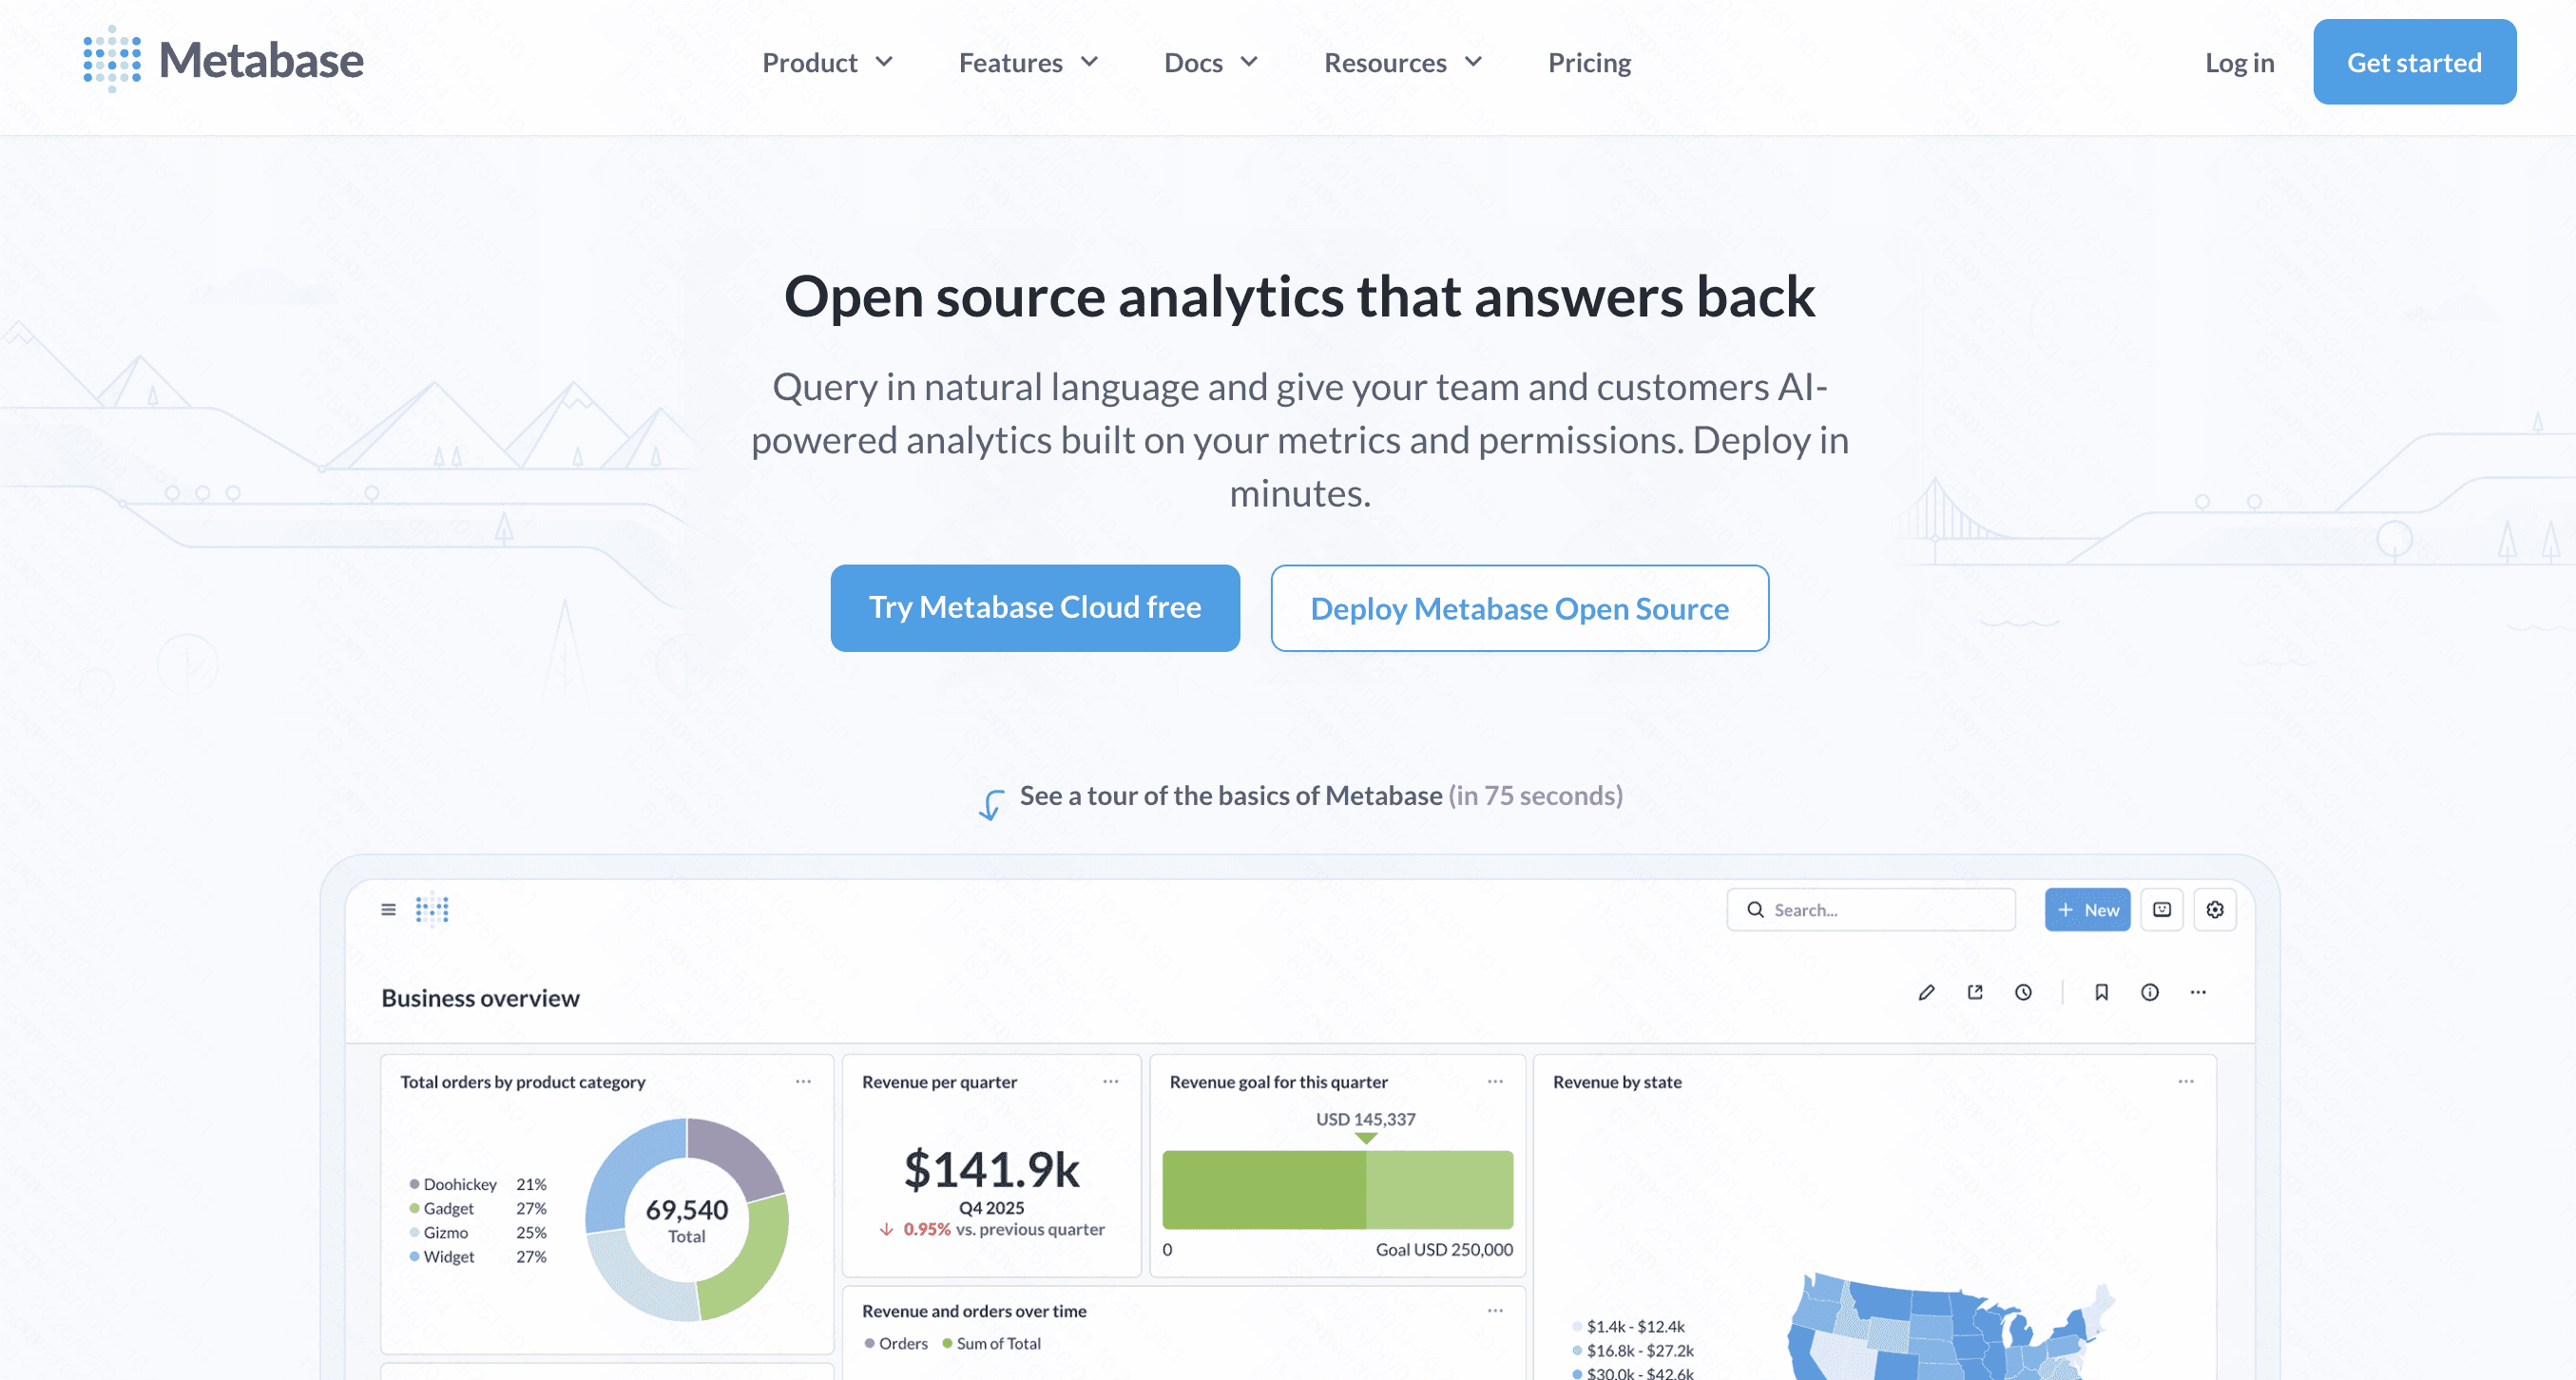
Key Features
Simple graphical query builder for non-technical users.
Open-source self-hosting options.
Automated dashboard creation via "X-ray" features.
Pros
Unbeatable cost-to-value ratio, especially for self-hosted setups.
Extremely fast setup time (time-to-insight).
Clean, highly intuitive user interface.
Cons
Struggles with extremely complex, multi-join analytical queries.
Visual customization options are somewhat limited.
Pricing
$100/month+ $6/month per user.
9. Julius AI
Julius AI serves as a virtual data analyst. Users simply upload a CSV or connect a database, and can immediately begin asking complex analytical questions using conversational natural language.
Key Features
Chat-based interface for data analysis and visualization.
Underlying execution of Python code to ensure mathematical accuracy.
Automated forecasting and predictive trend lines.
Pros
Makes advanced statistical analysis accessible to anyone.
Reduces the time spent writing complex spreadsheet formulas.
Highly accurate due to its Python-backed engine.
Cons
Primarily chart-focused; not ideal for building full, structured dashboards.
Prompt engineering is required to get highly specific data cuts.
Pricing
Free basic use; Premium starts at $20/month.
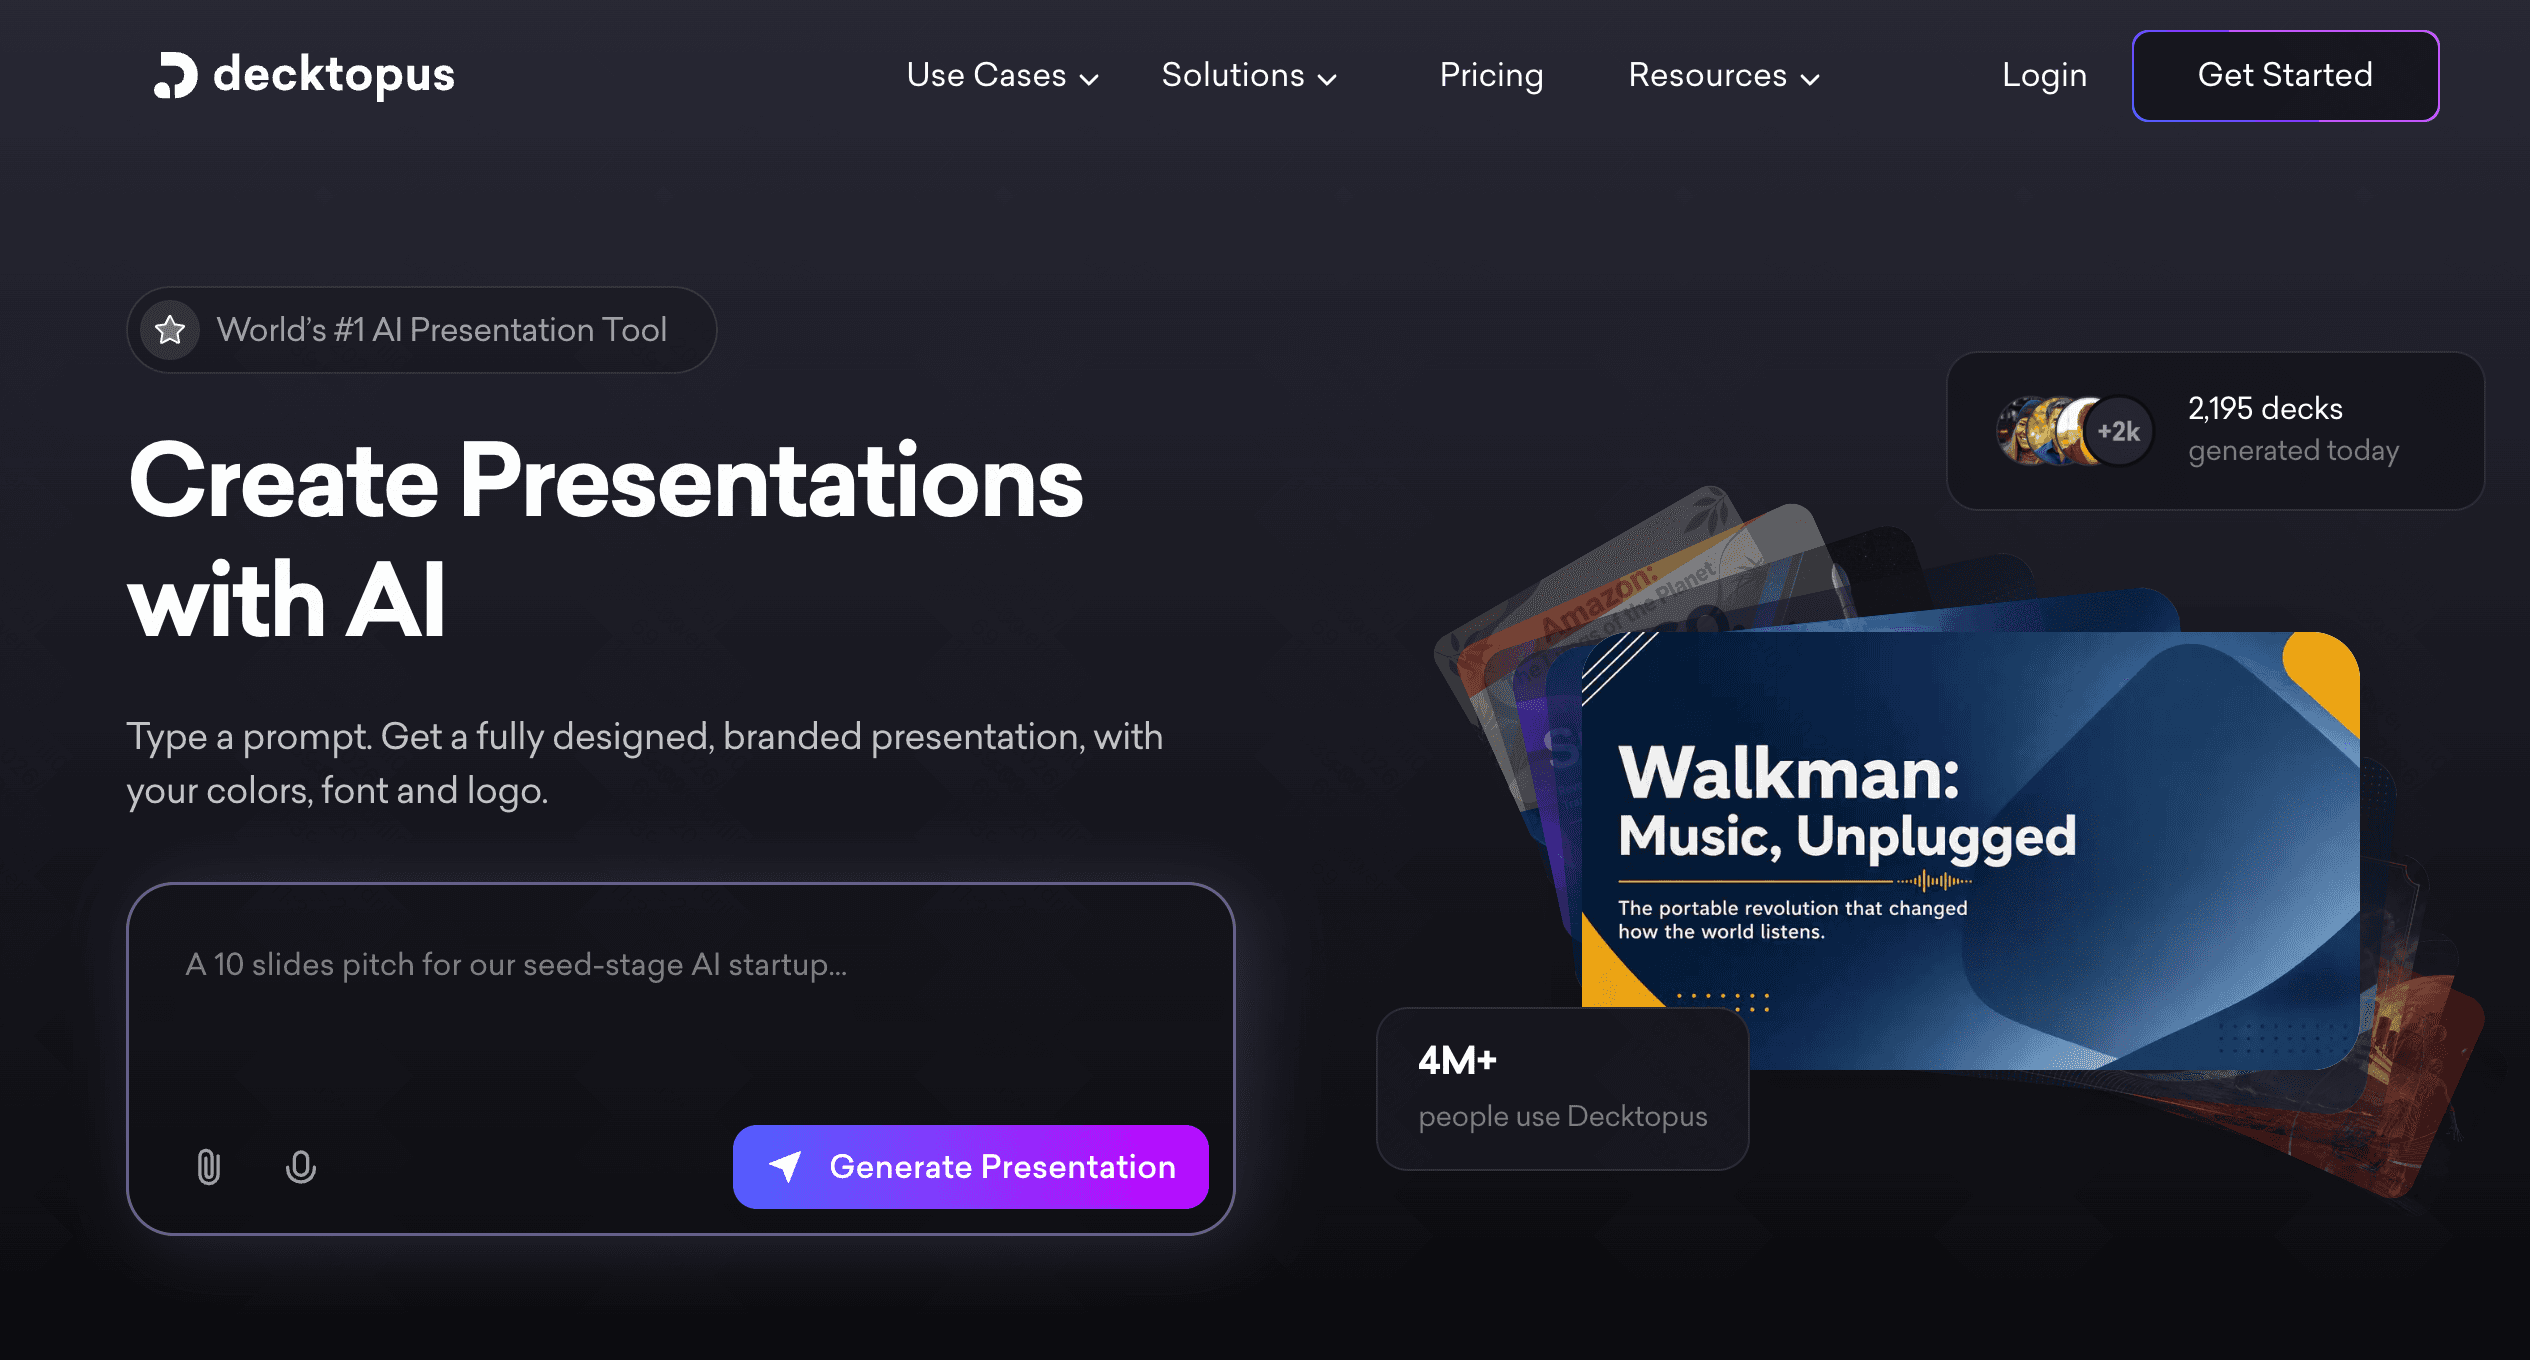
10. Decktopus AI
While traditionally known as an AI presentation tool, Decktopus AI has evolved into a smart platform for professionals who need to quickly format data insights and business reports into digestible, shareable assets.
Key Features
AI-generated layouts tailored for reporting and data sharing.
Built-in forms and interactive slide elements.
Rapid template swapping for business metric displays.
Pros
Extremely fast for generating weekly or monthly data report decks.
Enforces clean design principles automatically.
Great for marketing and sales metric presentations.
Cons
Does not perform raw data computation or database querying itself.
Best used alongside a pure analytics tool rather than replacing one.
Pricing
Pro plan starts at $14.99/per user month.
Which Alternative Is Best for Different Use Cases
Selecting the right tool depends heavily on your team's technical expertise and ultimate goals:
For Enterprise Self-Service: ThoughtSpot and Sigma are unparalleled in allowing business users to query cloud warehouses securely.
For Technical Data Teams: Hex and Mode offer the best environments for analysts writing SQL and Python.
For Budget-Conscious Teams: Metabase provides an incredible, open-source entry point for fast data visualization.
For Executive Storytelling: Powerdrill Bloom is the undisputed champion for instantly turning raw numbers into presentation-ready narratives.
Why More Teams Are Choosing Powerdrill Bloom
When it comes to smarter data analysis, finding the insight is only half the battle; communicating it effectively is the other. Teams are migrating to Powerdrill Bloom because:
Frictionless Workflow: It eliminates the need to jump between a BI dashboard and PowerPoint.
AI-Native Parsing: Its engine actually understands the context of your data, suggesting the right charts rather than waiting for manual inputs.
Rapid Delivery: It empowers managers and marketers to generate boardroom-ready reports in seconds, completely bypassing IT bottlenecks.
Conclusion
Moving away from Power BI and Tableau does not mean sacrificing analytical depth; rather, it means embracing platforms that align with modern, agile workflows. Whether you choose the spreadsheet simplicity of Sigma, the collaborative coding of Hex, or the search-driven power of ThoughtSpot, the future of data is fast and accessible.
However, if your goal is to seamlessly transition from raw data to a compelling, presentation-ready narrative, Powerdrill Bloom is the ultimate choice. Try Powerdrill Bloom today to experience smarter data analysis and elevate your business storytelling effortlessly.
FAQs
Why switch from Power BI or Tableau?
Teams switch to avoid steep learning curves, reduce reliance on IT, and utilize modern AI for faster insights.
Is AI reliable for data analysis?
Yes, modern AI tools parse data accurately and even generate underlying code (like Python) to ensure mathematical precision.
Can non-technical users build dashboards?
Absolutely. Tools like Metabase, ThoughtSpot, and Powerdrill Bloom are specifically designed for users with zero SQL knowledge.
Do these alternatives connect to cloud warehouses?
Yes, most top alternatives natively integrate with cloud databases like Snowflake, BigQuery, and Amazon Redshift effortlessly.
What is the best tool for data presentations?
Powerdrill Bloom is the top choice, uniquely combining intelligent data parsing with stunning, automated slide generation capabilities.