10 Best Excel Alternatives for Data Analysis in 2026 (No-BS Comparison)

Data analysis has evolved far beyond simple grids and manual calculations. While traditional spreadsheets have been the backbone of business operations for decades, modern data demands often push these legacy tools to their breaking points. If you are constantly dealing with crashing files, complex macros, or overwhelming data sets, it is time to upgrade your tech stack.
Today’s market offers incredibly powerful alternatives that leverage artificial intelligence, relational database structures, and advanced cloud computing to streamline your workflow. Whether you are looking for automated insights, stunning visual dashboards, or a virtual AI partner that does the heavy lifting for you, finding the right tool can completely transform how you interact with your data. In this comprehensive guide, we will cut through the marketing fluff and give you a no-nonsense comparison of the best Excel alternatives available for data analysis right now.
What is Excel
Before exploring alternatives, it is crucial to understand what Microsoft Excel fundamentally is and why it has dominated the market:
The Industry Standard: Excel is a spreadsheet program developed by Microsoft, globally recognized as the default tool for data entry, accounting, and basic data manipulation.
Grid-Based Architecture: It operates on a straightforward interface of rows and columns, allowing users to organize raw data structurally.
Formula and Function Engine: It boasts hundreds of built-in mathematical, statistical, and financial functions (like VLOOKUP and XLOOKUP) for data processing.
Basic Visual Analytics: It provides foundational visualization features, including Pivot Tables, bar charts, line graphs, and scatter plots.
Automation: Through Visual Basic for Applications (VBA), advanced users can write macros to automate repetitive tasks.
What to Look for in an Excel Alternative for Data Analysis
When transitioning away from traditional spreadsheets, you need a platform that solves legacy limitations. Here is what you should evaluate:
AI and Automation Capabilities: Look for tools that allow you to analyze data using natural language, automatically uncover trends, and generate insights without writing complex formulas.
High-Volume Data Handling: The ideal alternative should comfortably process millions of rows of data without freezing or crashing.
Context Retention: Advanced tools should remember past interactions and project contexts, so you do not have to start your analysis from scratch every single session.
Advanced Visualization: A strong alternative must offer interactive dashboards, presentation-ready charts, and auto-generated visual reports.
Seamless Workflow Integration: The best platforms go beyond just analyzing numbers; they participate in your entire workflow, from research and task execution to content organization.
Quick Comparison: 10 Best Excel Alternatives for Data Analysis
Here is a quick overview of the top 10 tools we will cover in this guide:
| Product | Best For | Key Strength | Pricing |
|---|---|---|---|
| 1. Powerdrill Bloom | End-to-end AI data analysis | AI workflow automation & context memory | $13.27/month |
| 2. Airtable | Database management | Relational data structuring | $20/month |
| 3. Smartsheet | Project tracking | Workflow & task management | $9/month |
| 4. Tableau | Big data visualization | Advanced visual dashboards | $15/month |
| 5. Microsoft Power BI | Enterprise analytics | Ecosystem integration | $14/month |
| 6. Datawrapper | Quick publishing | Beautiful, embeddable charts | $25/month |
| 7. Quadratic | Data scientists & devs | Infinite canvas with Python/SQL | $20/month |
| 8. Julius AI | Conversational analytics | AI-driven statistical modeling | $20/month |
| 9. Sigma Computing | Cloud data warehousing | Spreadsheet UI for Snowflake/BigQuery | Custom |
| 10. LibreOffice Calc | Offline spreadsheet use | Free, open-source compatibility | Free |
1. Powerdrill Bloom
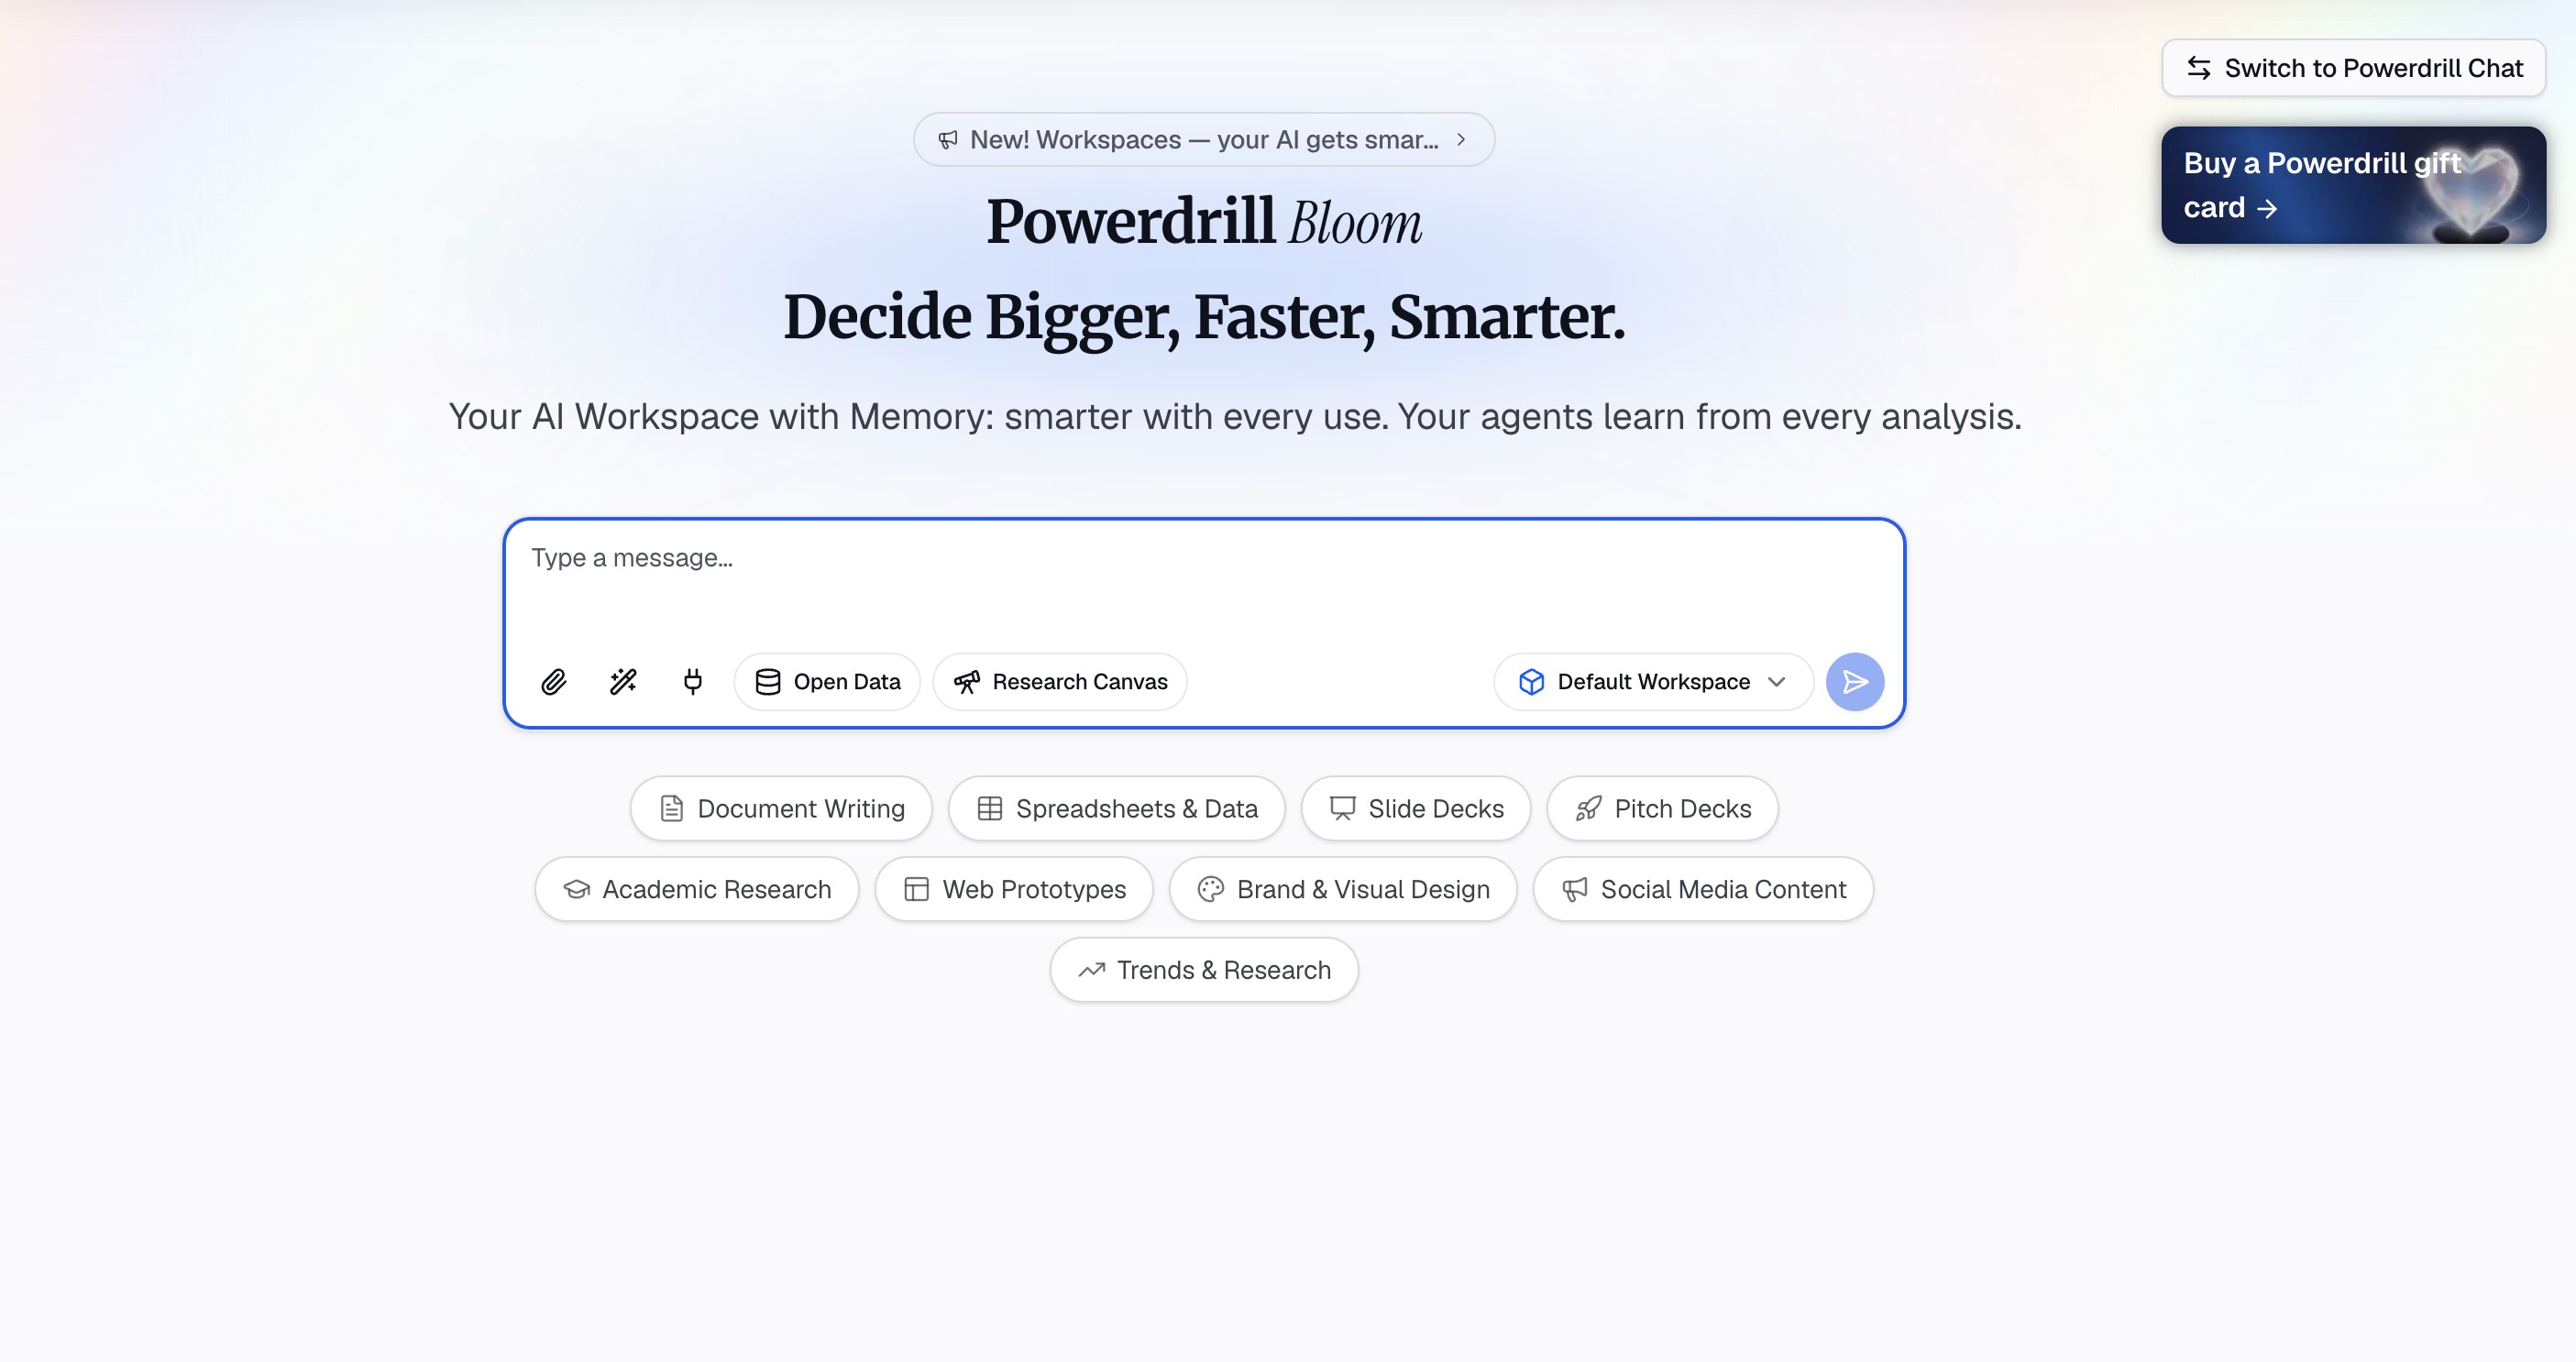
When looking for the absolute best Excel alternative for data analysis, Powerdrill Bloom stands in a league of its own. Powerdrill Bloom is an AI-powered workspace designed to help users turn data, files, and information into actionable insights and results. Rather than simply answering questions, Bloom can participate in the entire workflow, helping with research, data analysis, content organization, report generation, and task execution. Users can upload CSV, Excel, and other files and interact with their data using natural language. From raw data to insights, visualizations, reports, and execution, Powerdrill Bloom brings multiple AI-powered workflows together in one connected workspace.
Key Features
Natural Language Interaction: Analyze datasets, identify trends and anomalies, and uncover key insights just by chatting.
Generative Visualization: Automatically generate charts, visual reports, and presentation-ready content.
Persistent Workspaces & MemoryLake: Provides persistent Workspaces where users can keep files, projects, and context organized across sessions, making it easier to continue ongoing work without starting from scratch. Integration with MemoryLake further enhances long-term memory, allowing Bloom to better understand and maintain relevant context over time.
Specialized AI Skills: Beyond data analysis, it supports specialized AI Skills for research, analysis, automation, and other complex tasks.
Pros
Eliminates the need to learn complex formulas, SQL, or Python.
True end-to-end workflow support (from raw data to final presentation).
Exceptional context retention over long-term projects.
Cons
Requires an internet connection to access AI capabilities.
A paradigm shift for users who strictly want an old-school grid interface.
Pricing
Freemium; Pro plan starts at $13.27/month.
2. Airtable
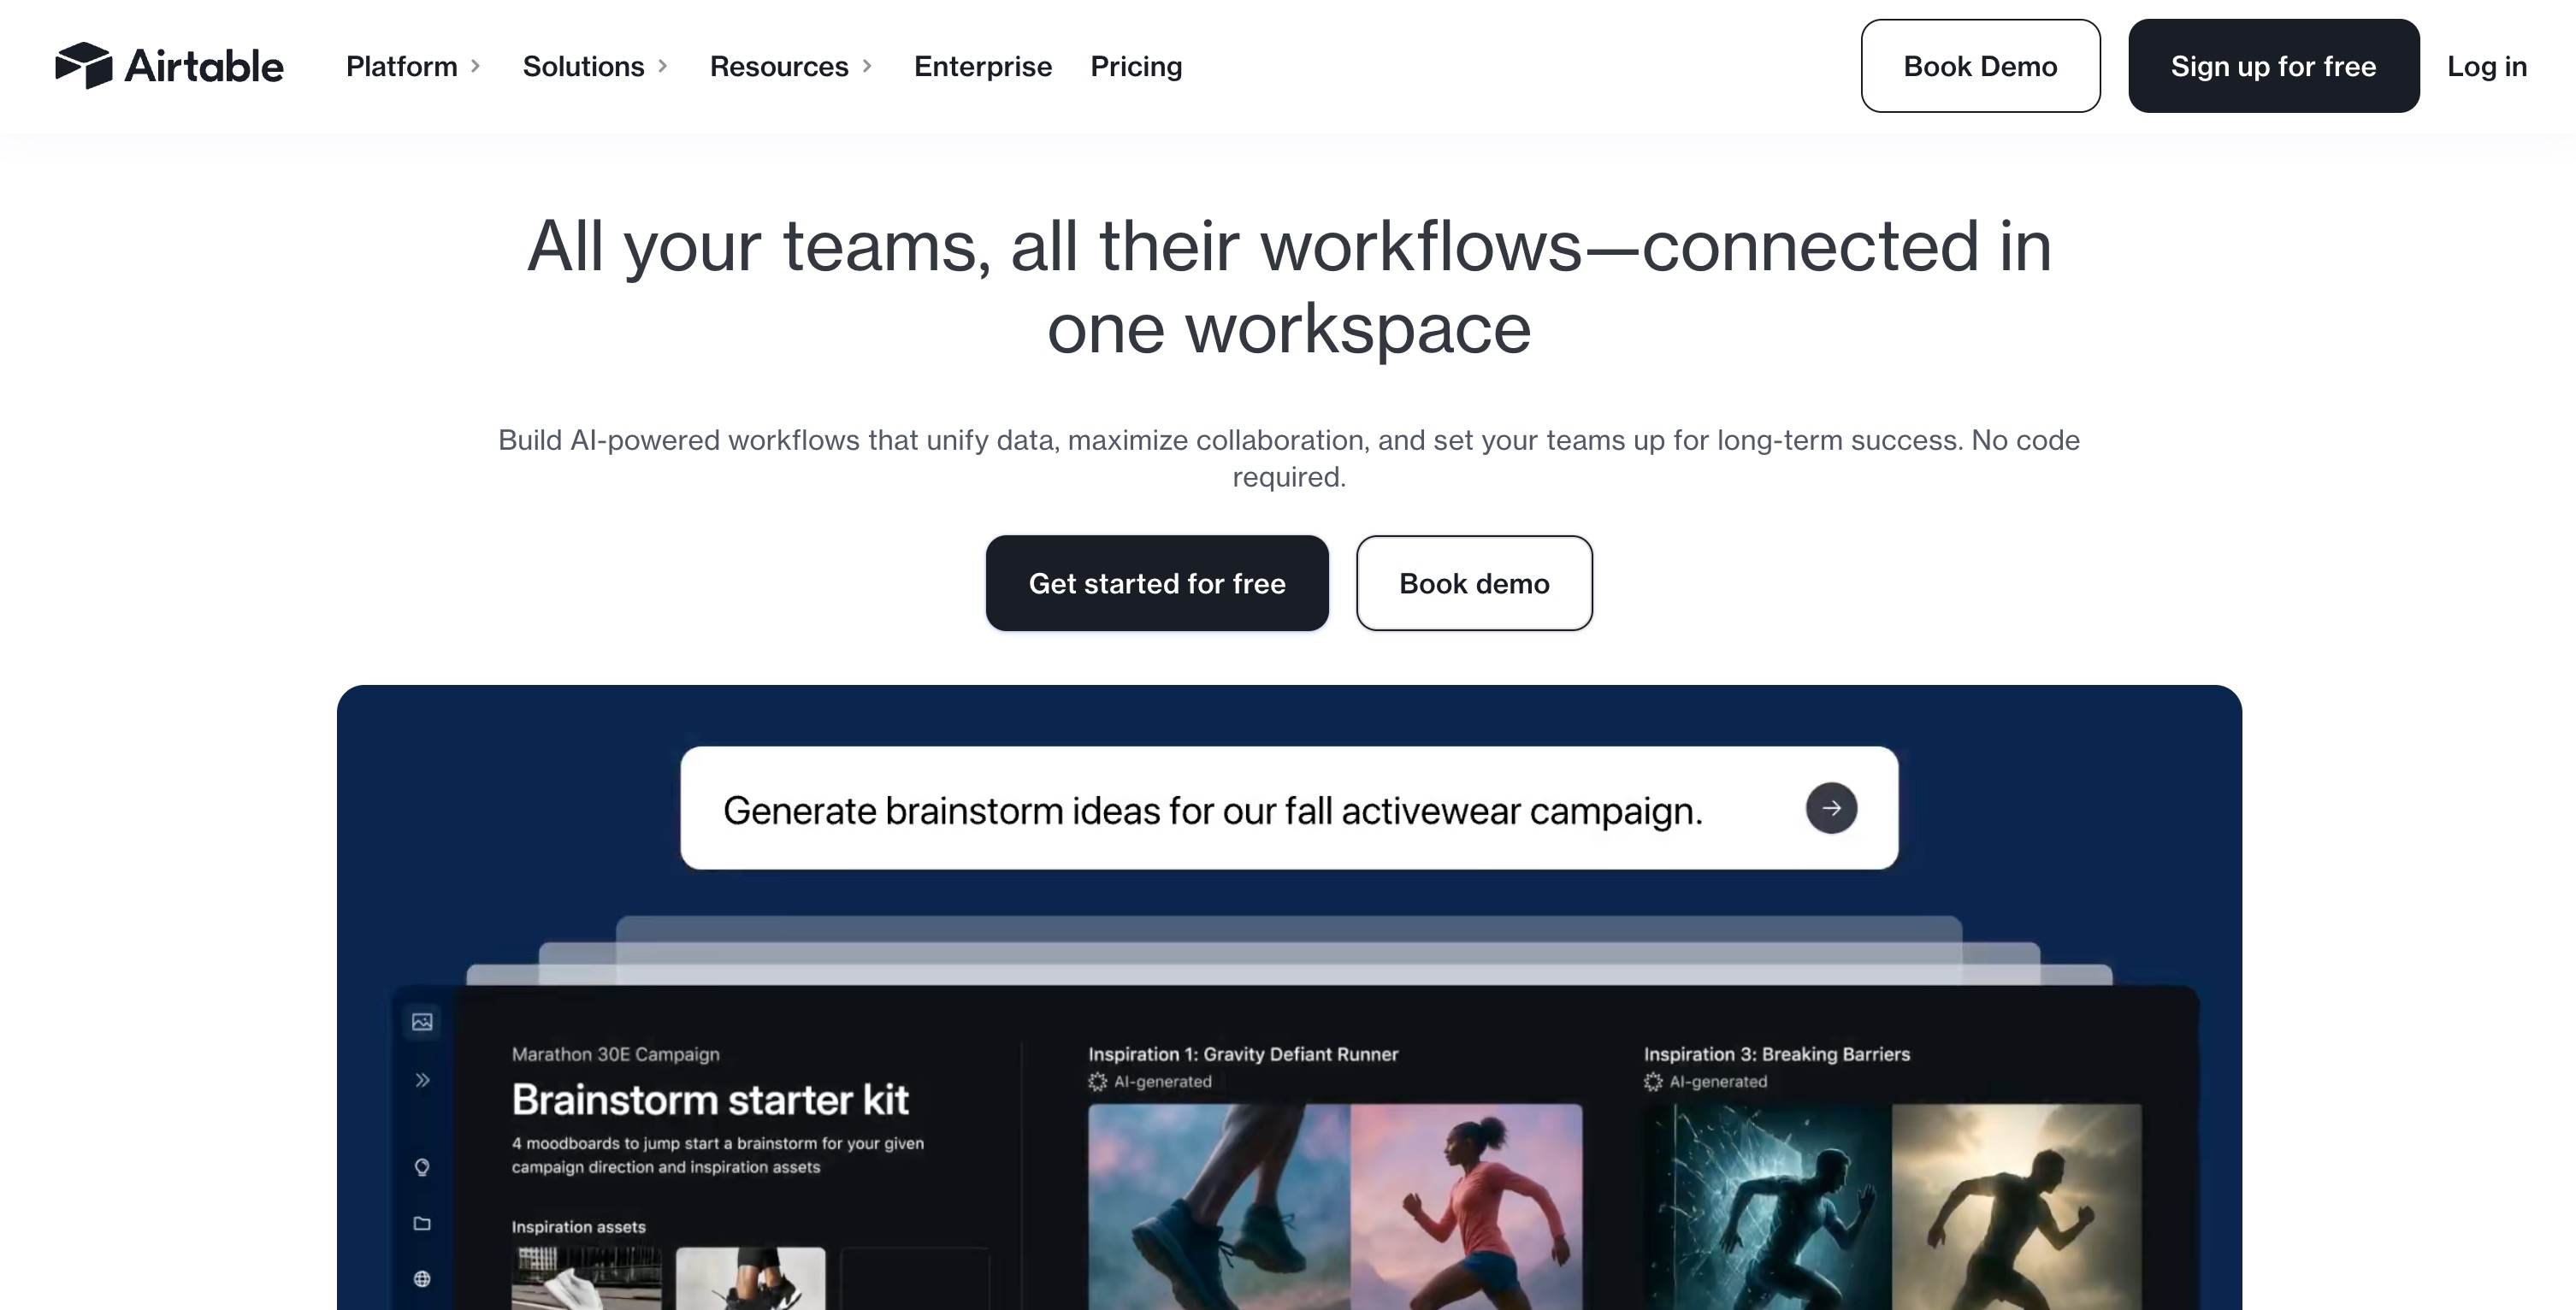
Airtable is a cloud-based platform that blends the simplicity of a spreadsheet with the power of a relational database. It is highly favored by operational teams who need to link records, track inventory, or manage content pipelines without writing SQL queries.
Key Features
Relational Records: Link data across different tables seamlessly.
Multiple Views: Switch between Grid, Kanban, Gantt, and Calendar views.
Automations: Built-in triggers to automate repetitive tasks and notifications.
Pros
Highly intuitive and visually appealing user interface.
Excellent for cross-functional team collaboration.
Strong ecosystem of integrations and templates.
Cons
Not designed for complex mathematical data analysis or heavy statistical modeling.
Strict record limits on lower-tier pricing plans.
Pricing
Free tier available; Team plans start at $20/user/month.
3. Smartsheet
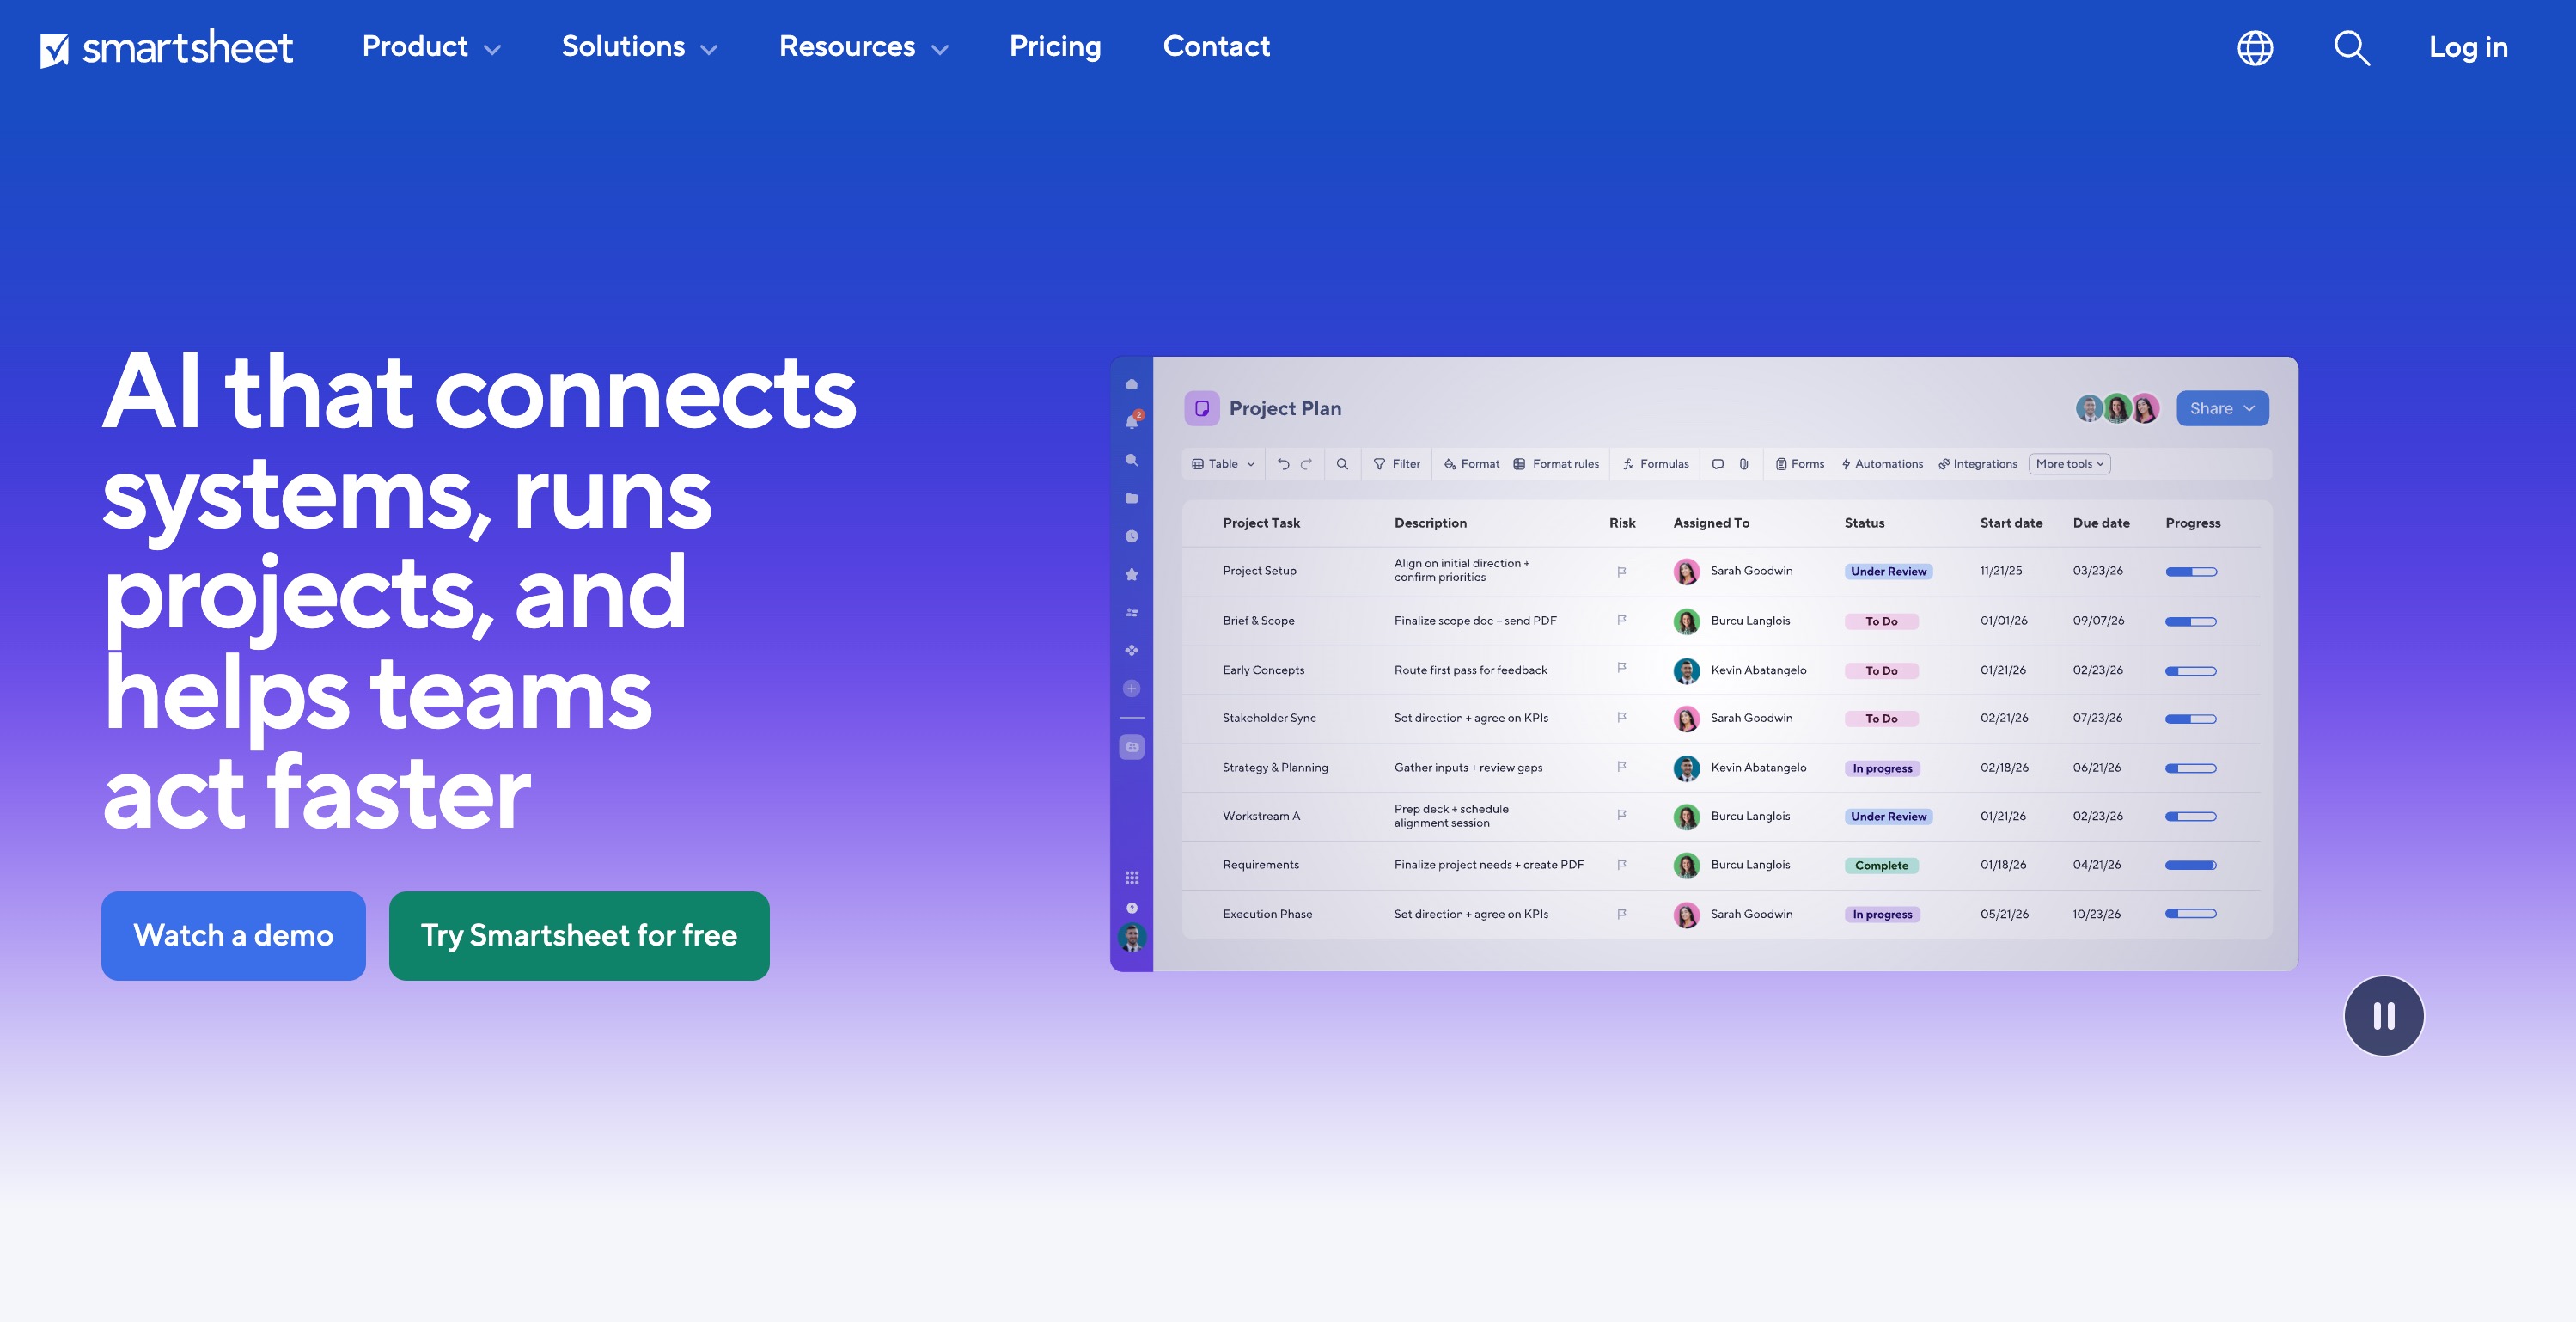
Smartsheet looks like a traditional spreadsheet but acts as a robust project management and execution tool. It is widely used by enterprise teams for tracking massive projects, resource management, and automated workflow approvals.
Key Features
Project Views: Native Gantt charts, card views, and resource management tools.
Automated Workflows: Rule-based automations for status updates and approvals.
Enterprise Security: High-grade compliance and security protocols.
Pros
Familiar spreadsheet interface lowers the learning curve.
Incredibly powerful for timeline and budget tracking.
Excellent reporting dashboards for executives.
Cons
Lacks advanced predictive analytics and AI data modeling.
Can feel clunky when used purely for raw numerical data analysis.
Pricing
Starts at $9/user/month for basic features.
4. Tableau
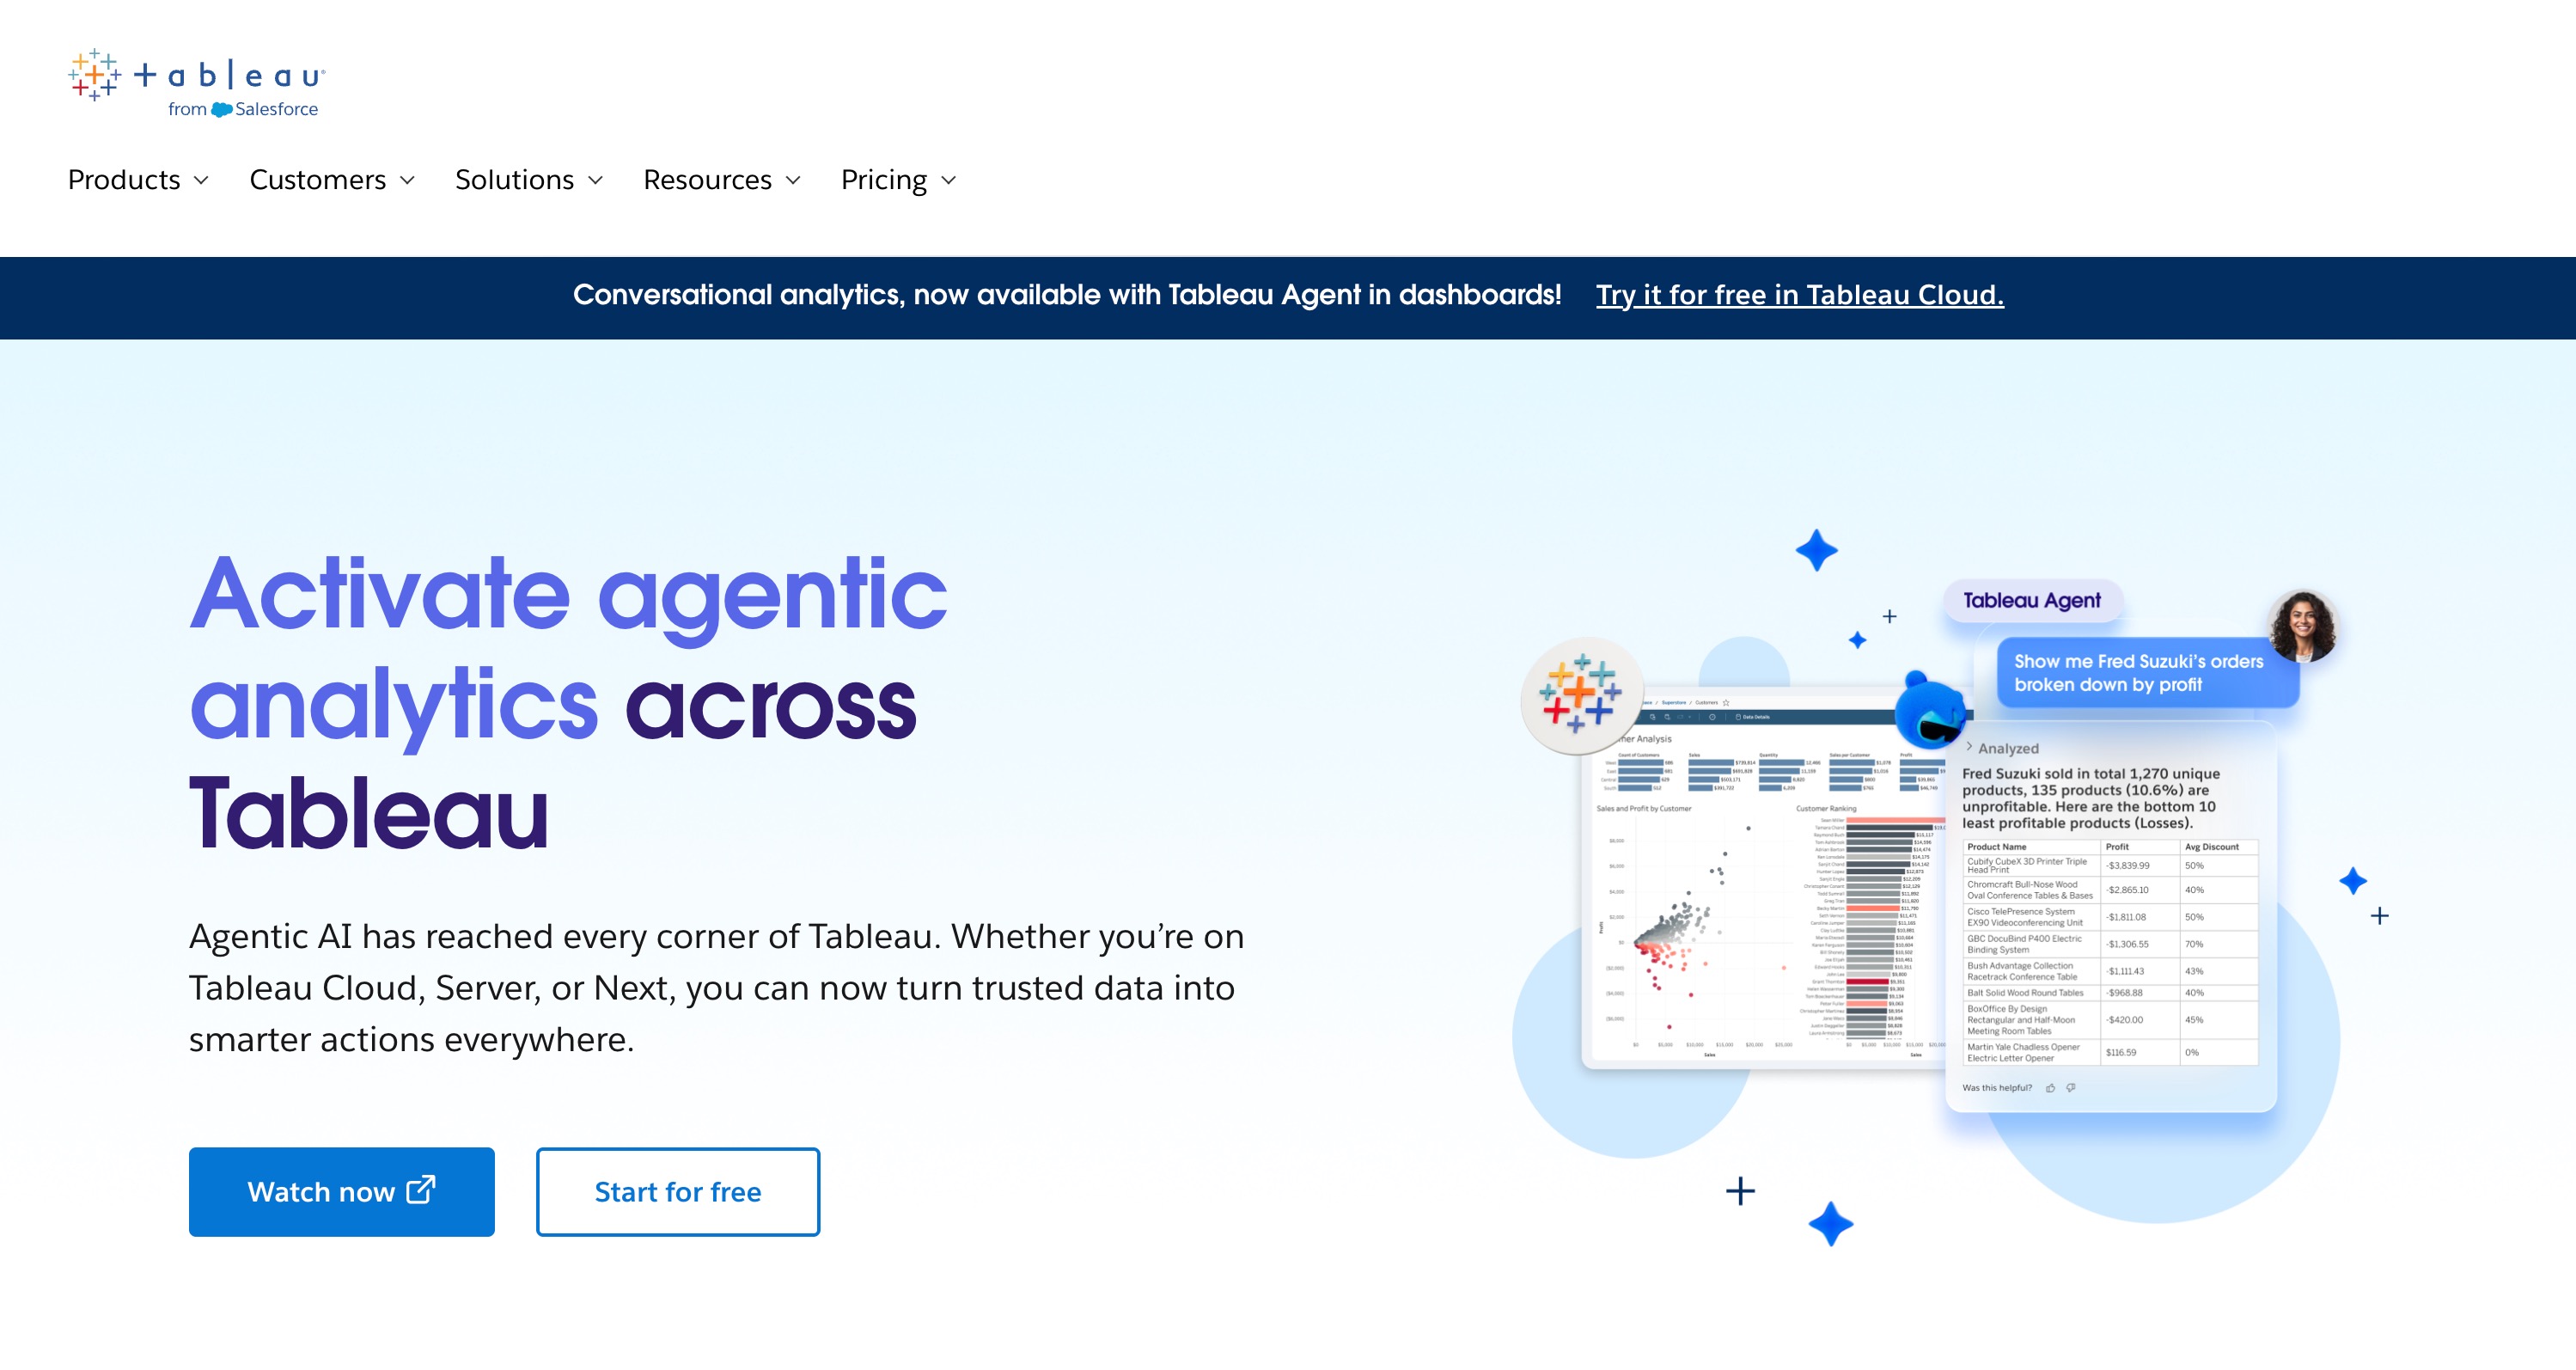
Tableau is a powerhouse in the business intelligence (BI) world. If your data analysis heavily relies on identifying visual trends from massive datasets, Tableau provides unparalleled visualization capabilities that traditional spreadsheets simply cannot handle.
Key Features
Drag-and-Drop Analytics: Build complex dashboards without coding.
Massive Data Capacity: Effortlessly connects to data warehouses processing billions of rows.
Interactive Dashboards: Create drill-down, highly interactive visual reports.
Pros
Industry-leading visualization options.
Connects to virtually any database or cloud source.
Thriving community for troubleshooting and templates.
Cons
Steep learning curve for non-analysts.
Very expensive, making it overkill for basic tasks.
Pricing
Tableau plan starts at $15/user/month.
5. Microsoft Power BI
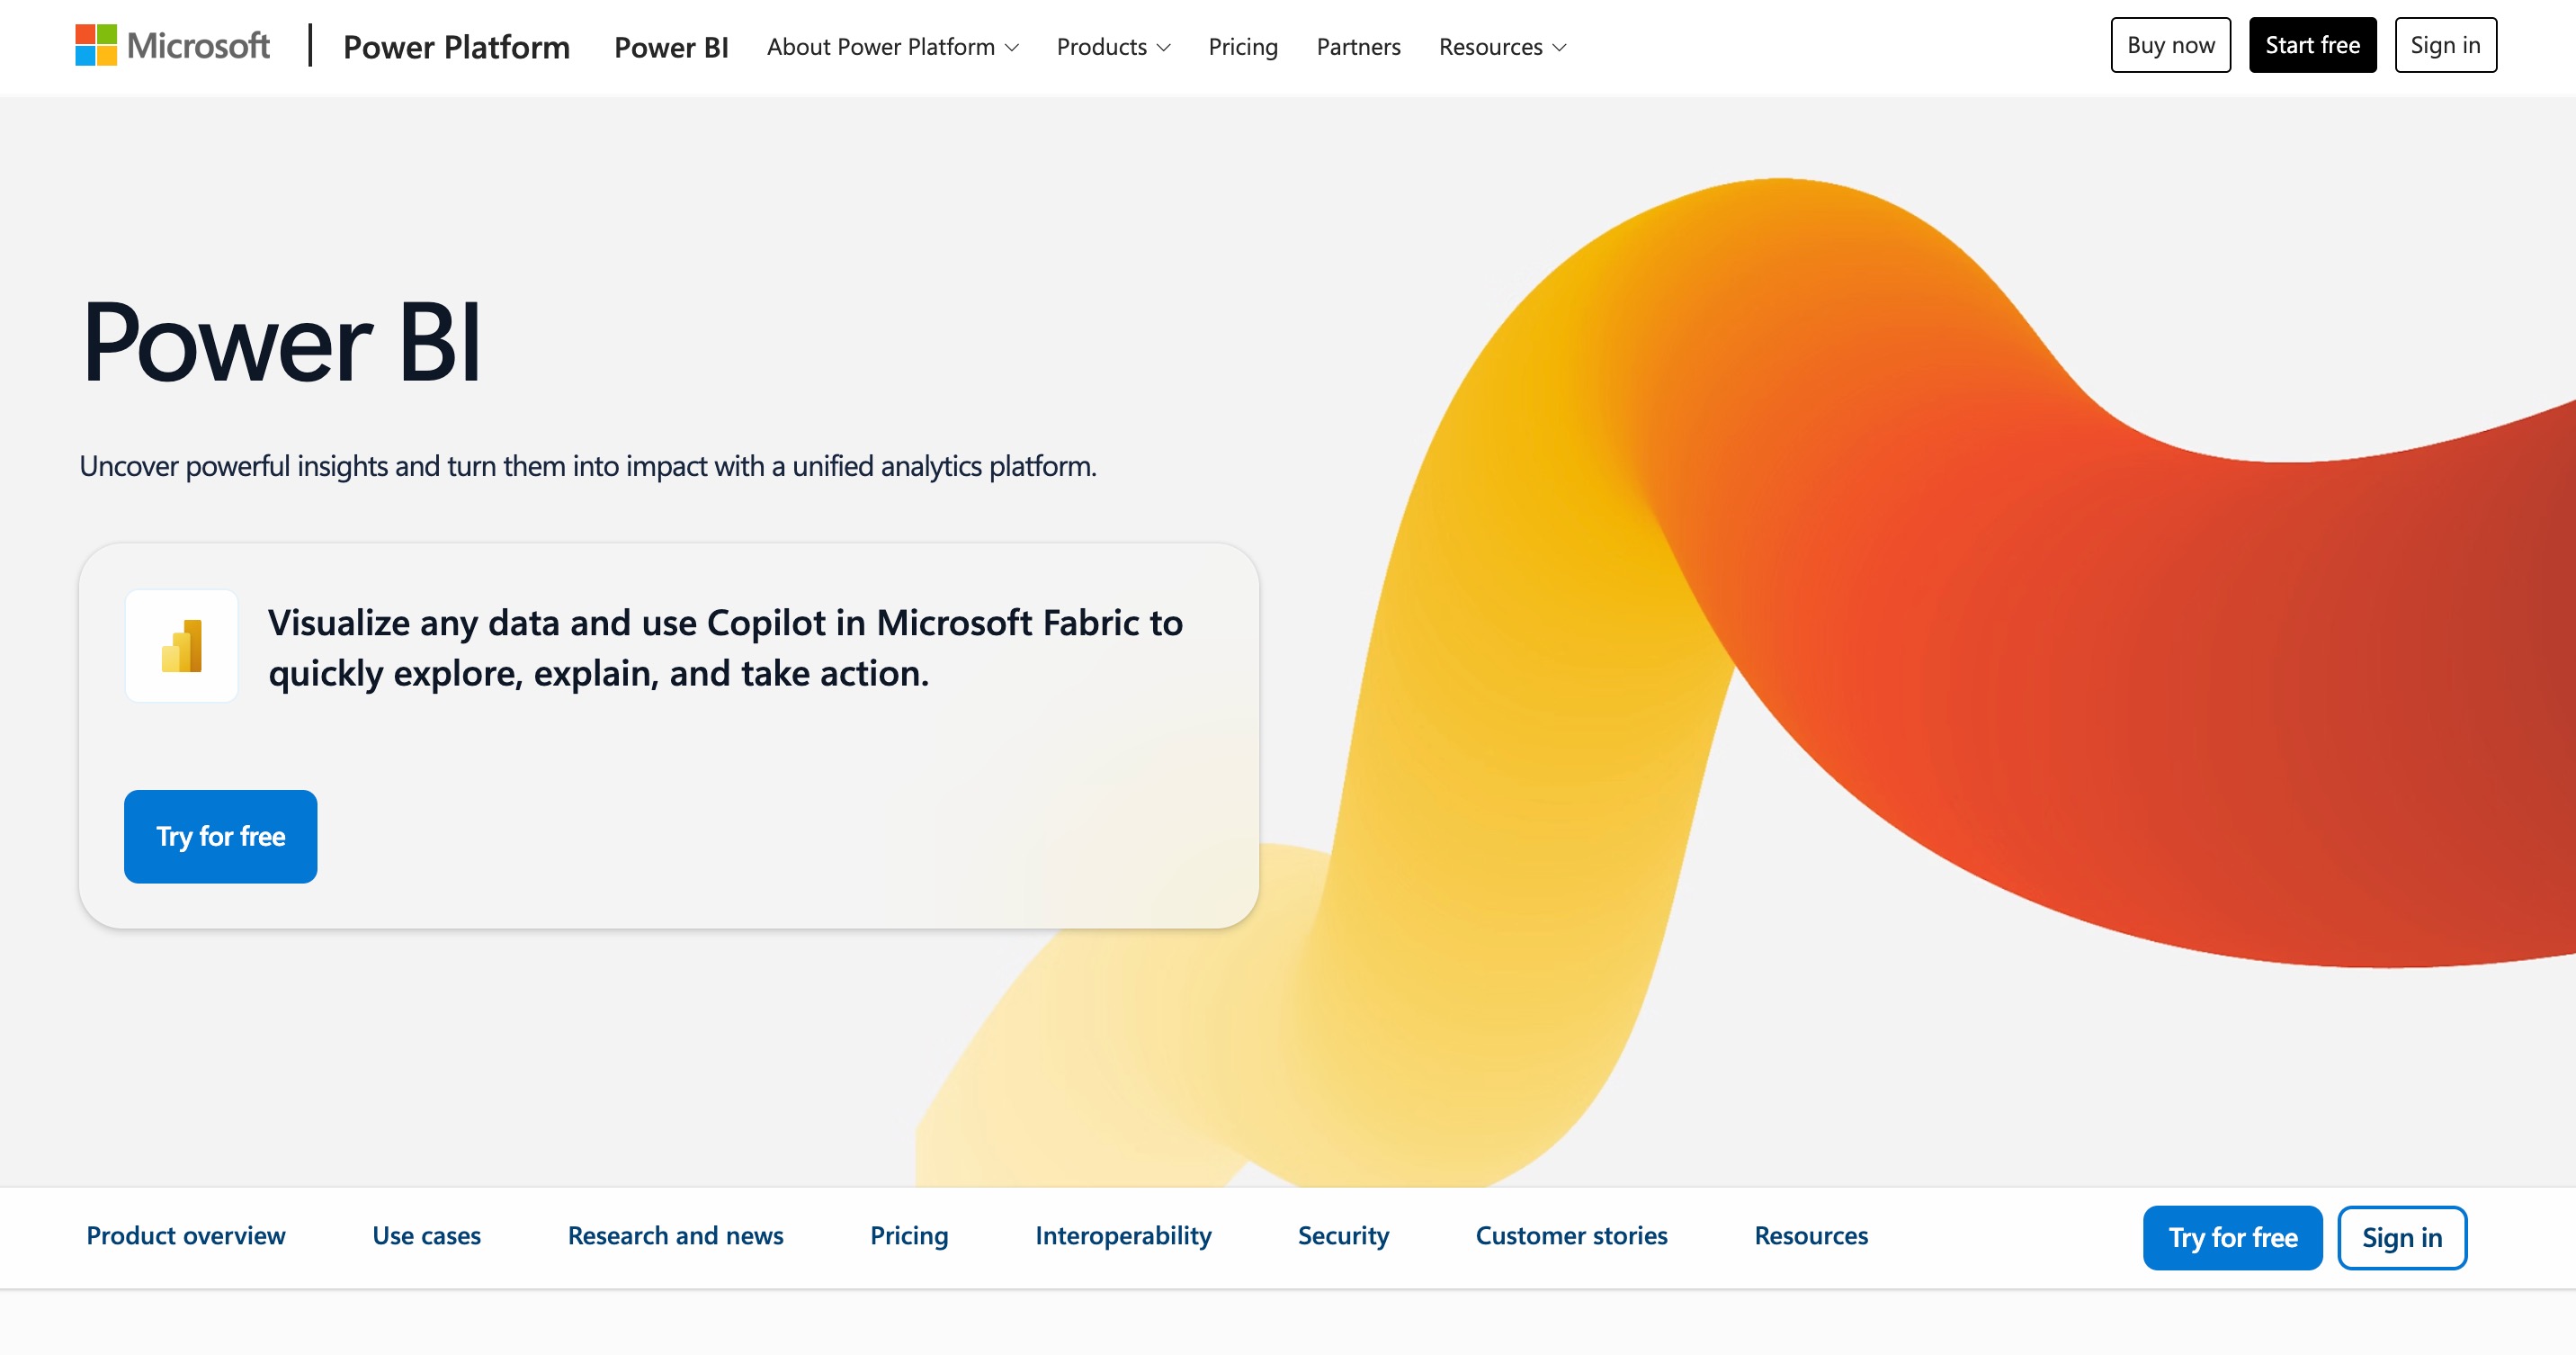
Often the natural upgrade for Excel power users, Power BI is Microsoft’s premier business analytics service. It allows organizations to unify data from multiple sources to create interactive, immersive dashboards and reports.
Key Features
Data Modeling (DAX): Use Data Analysis Expressions for deep logical data manipulation.
Seamless Microsoft Integration: Works perfectly with Excel, Azure, and Teams.
Real-time Analytics: Dashboards update instantly as underlying data changes.
Pros
Incredibly cost-effective for organizations already using Microsoft 365.
Handles vastly more data than Excel.
Strong data cleaning and transformation tools (Power Query).
Cons
DAX formulas can be incredibly difficult to master.
The desktop application is restricted to Windows OS.
Pricing
Power BI Pro starts at $14/user/month.
6. Datawrapper
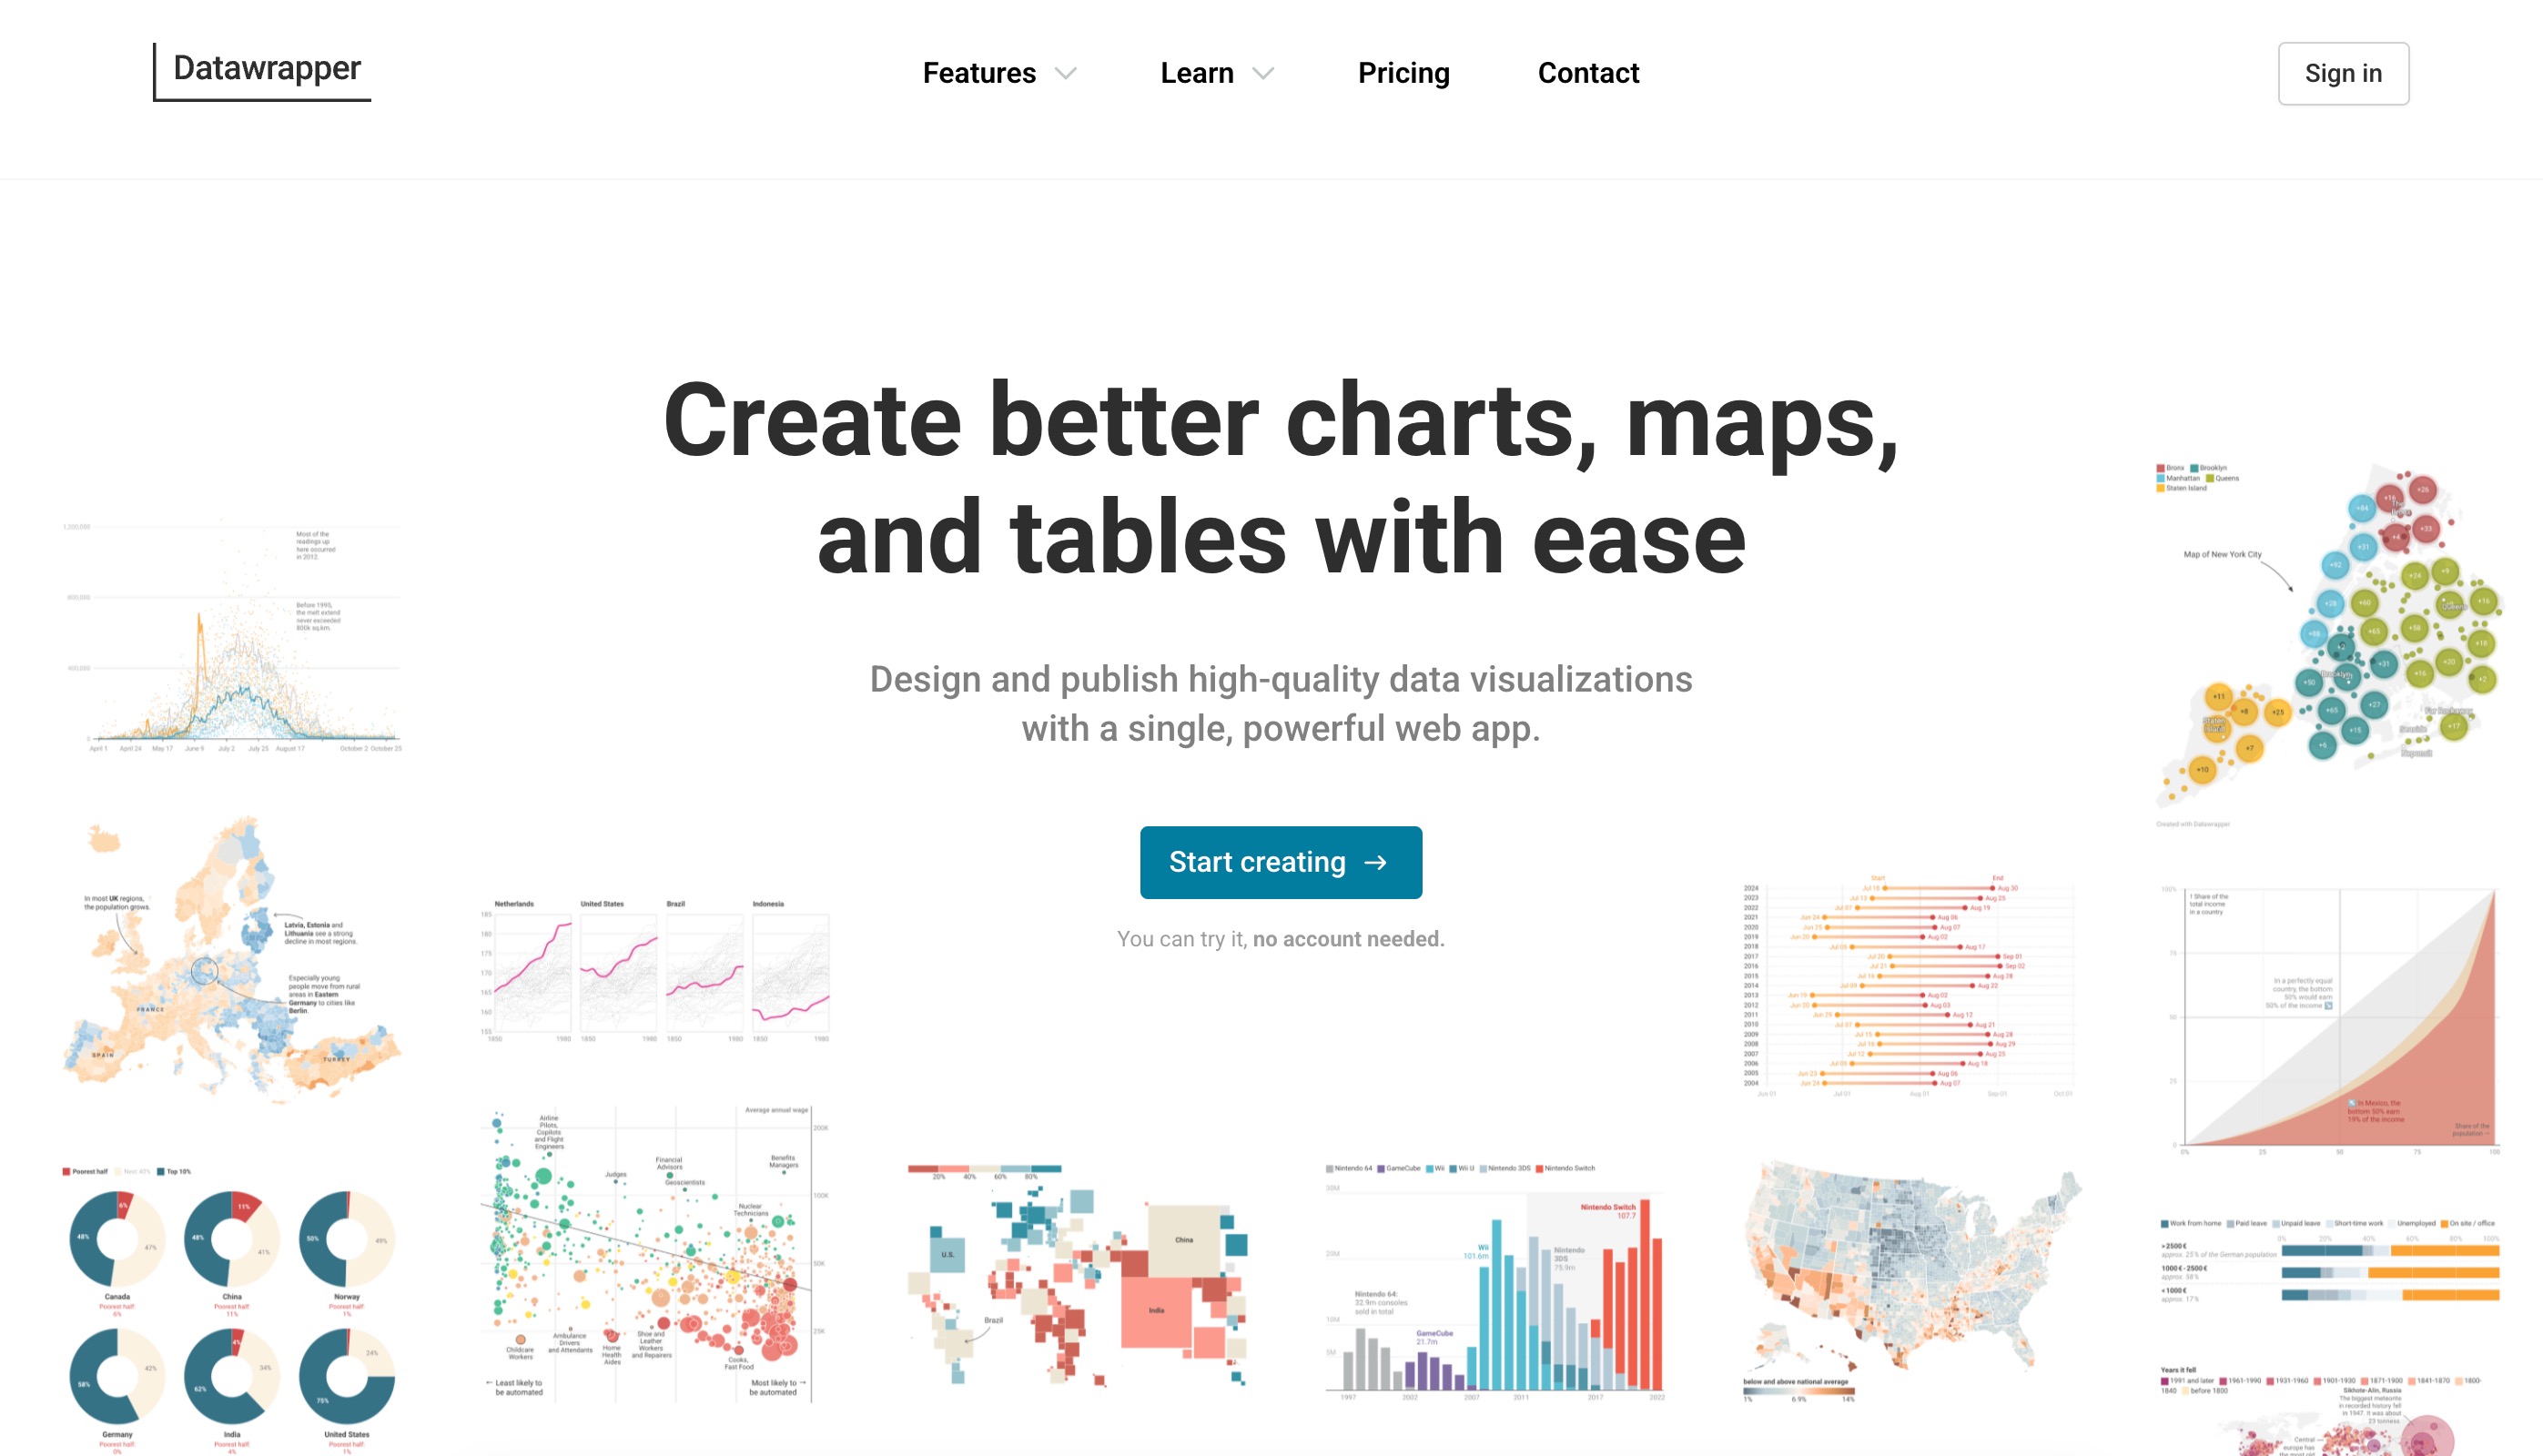
Datawrapper is a niche, highly specialized tool created for journalists and content creators. It focuses purely on turning flat data into beautiful, embeddable charts, maps, and tables with zero coding required.
Key Features
Copy-Paste Import: Instantly turn pasted data into a chart.
Responsive Design: Visualizations automatically adapt to mobile or desktop screens.
Interactive Maps: Built-in templates for geographic data visualization.
Pros
Incredibly fast workflow for publishing.
Beautiful, professional-grade default aesthetics.
Requires zero design or coding skills.
Cons
Not a tool for raw data manipulation or statistical analysis.
Very high cost for premium custom branding.
Pricing
$25/month.
7. Quadratic
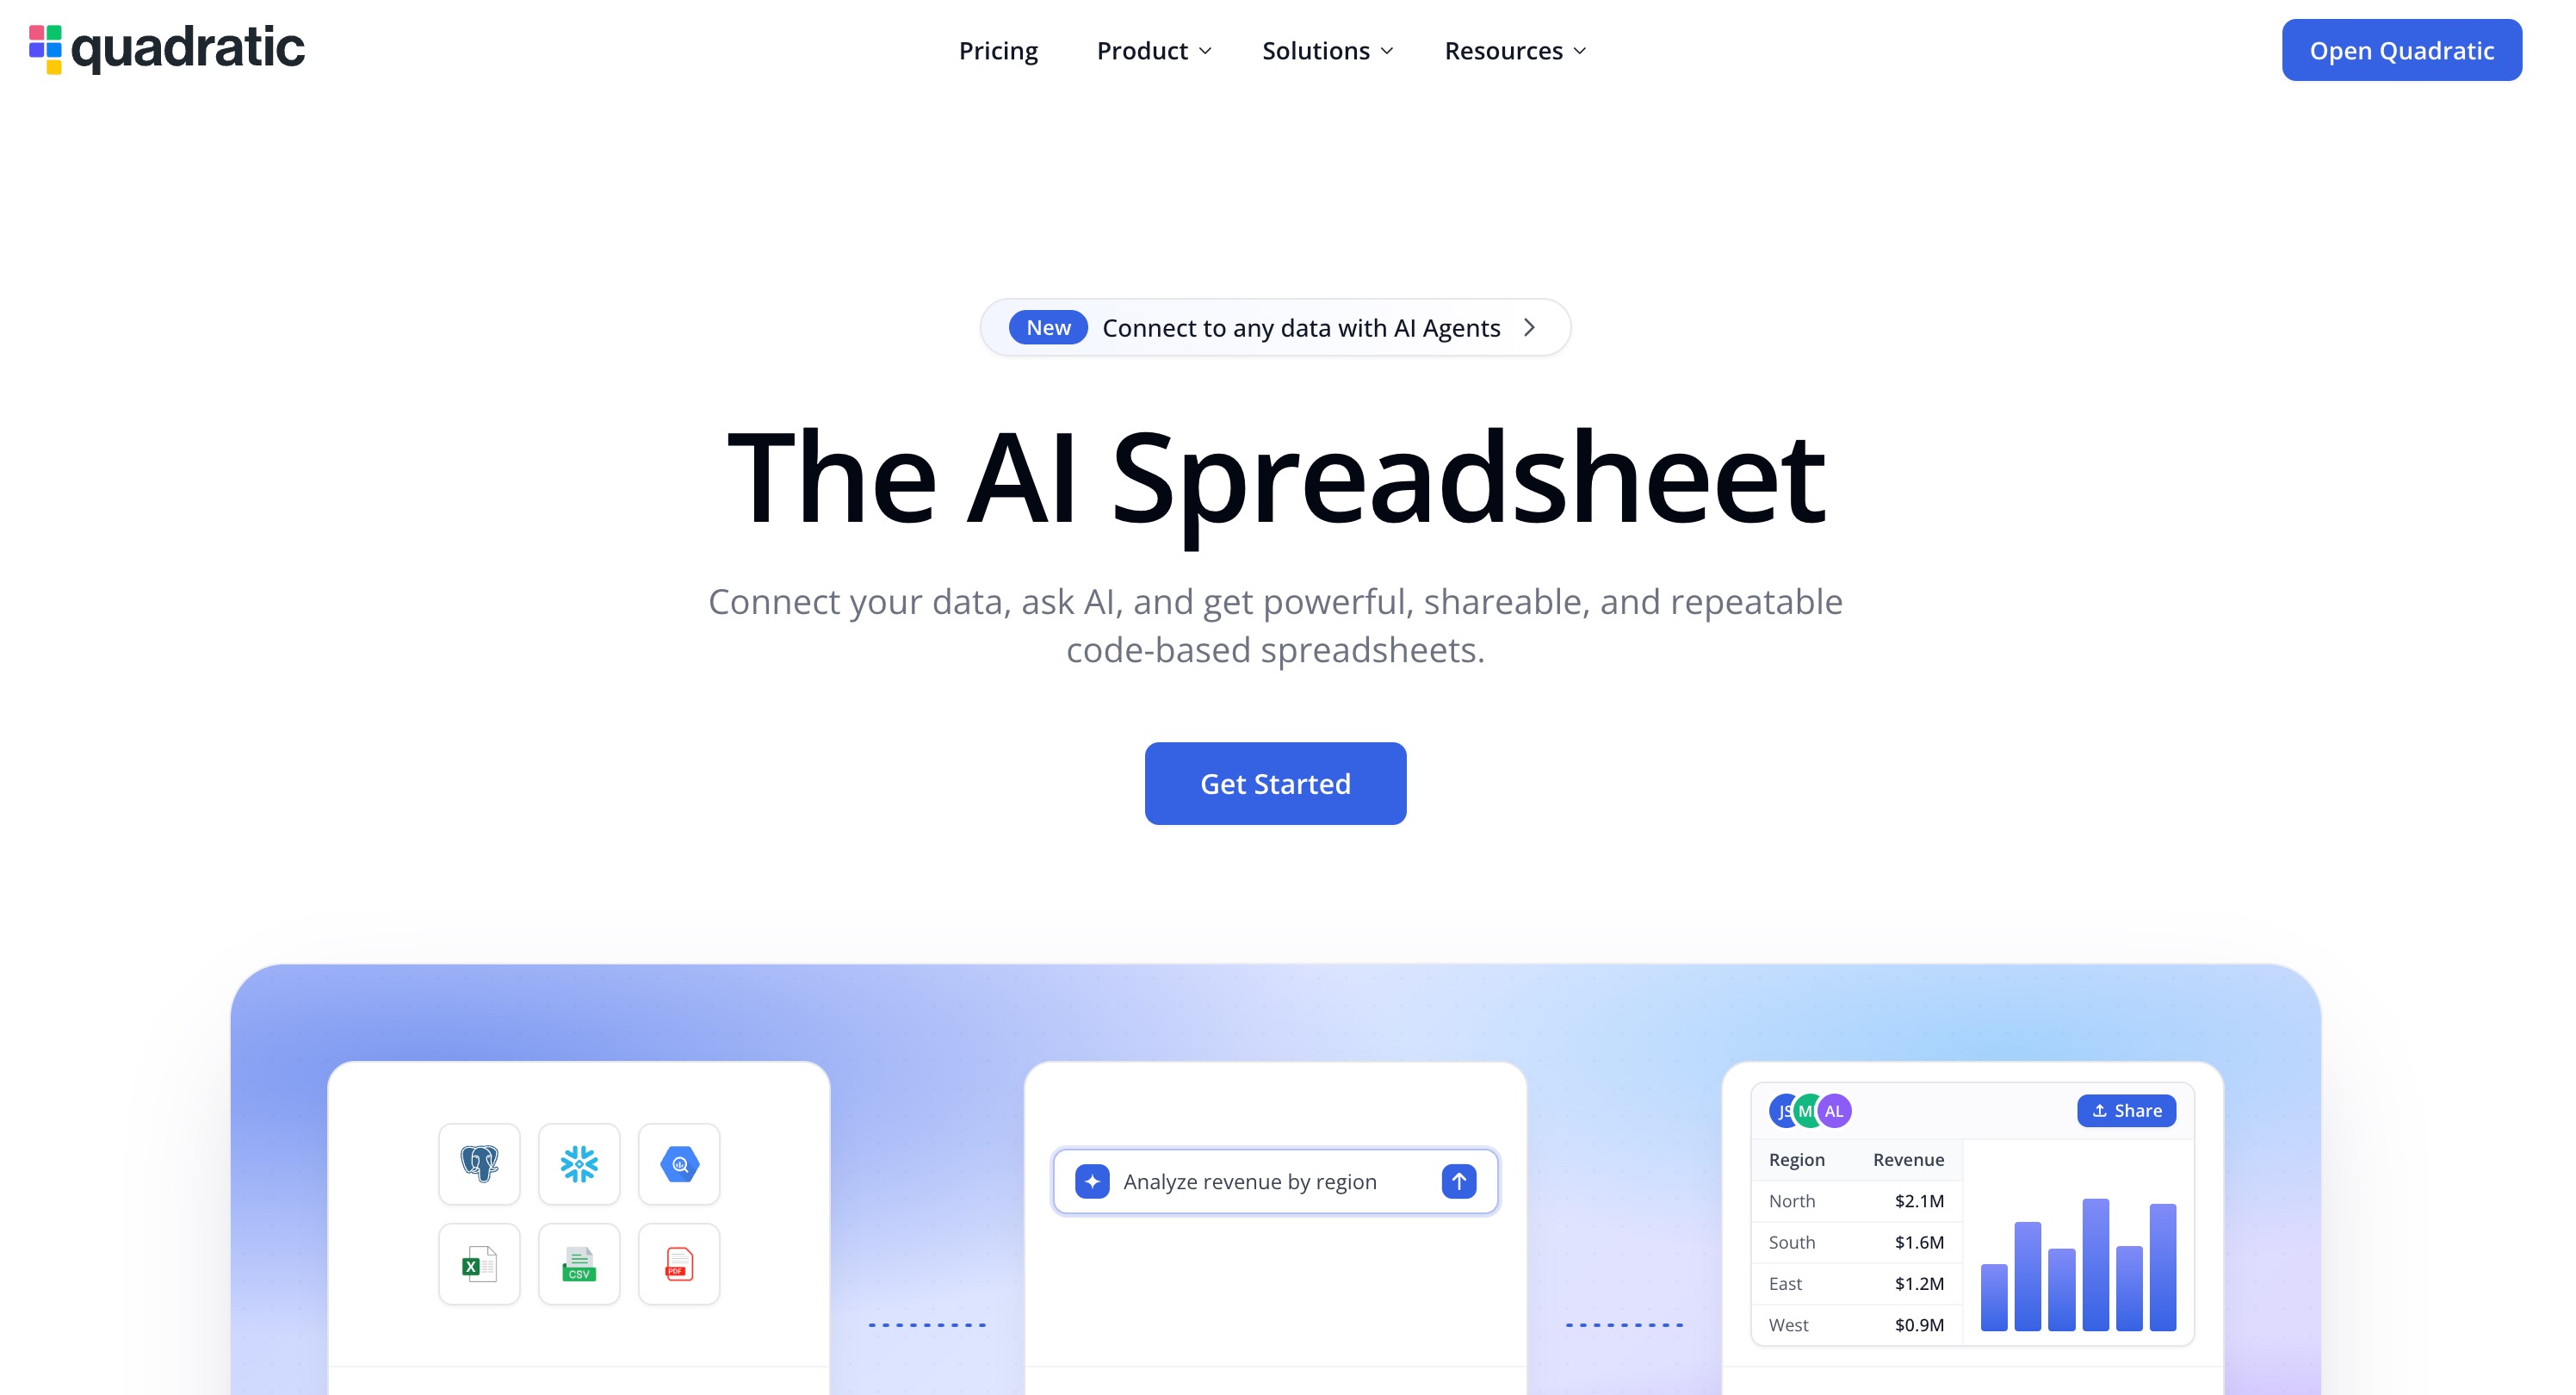
Quadratic reimagines the spreadsheet as an infinite digital canvas built explicitly for developers, data scientists, and engineers. It allows users to mix traditional spreadsheet formulas with full-blown programming languages.
Key Features
Infinite Canvas: A WebGL-rendered infinite grid that never slows down.
Multi-Language Support: Write Python, SQL, and Excel formulas in adjacent cells.
Live Data Pulls: Direct integrations to pull live data from APIs and databases.
Pros
Perfect for technical users wanting to leverage Python within a grid.
Smooth, lag-free performance on massive datasets.
Great for blending different data structures.
Cons
Requires coding knowledge to unlock its true value.
Lacks the robust visualization features of dedicated BI tools.
Pricing
Free for individuals; Pro tiers start at $20/month.
8. Julius AI
Julius AI is a conversational data analyst. Users upload their datasets, and the AI writes and executes Python code in the background to analyze the data, build models, and generate charts.

Key Features
Chat Interface: Analyze data through a conversational UI.
Code Export: View and export the Python code the AI generated.
Animation Generation: Can output animated charts and advanced graphs.
Pros
Excellent for complex statistical and mathematical modeling.
Highly transparent (you can see the code it writes).
Fast ad-hoc analysis.
Cons
Lacks the persistent, holistic workspace memory found in Powerdrill Bloom.
Strictly a chat-to-data tool, less suited for project task execution.
Pricing
Free basic plan; Premium starts at $20/month.
9. Sigma Computing
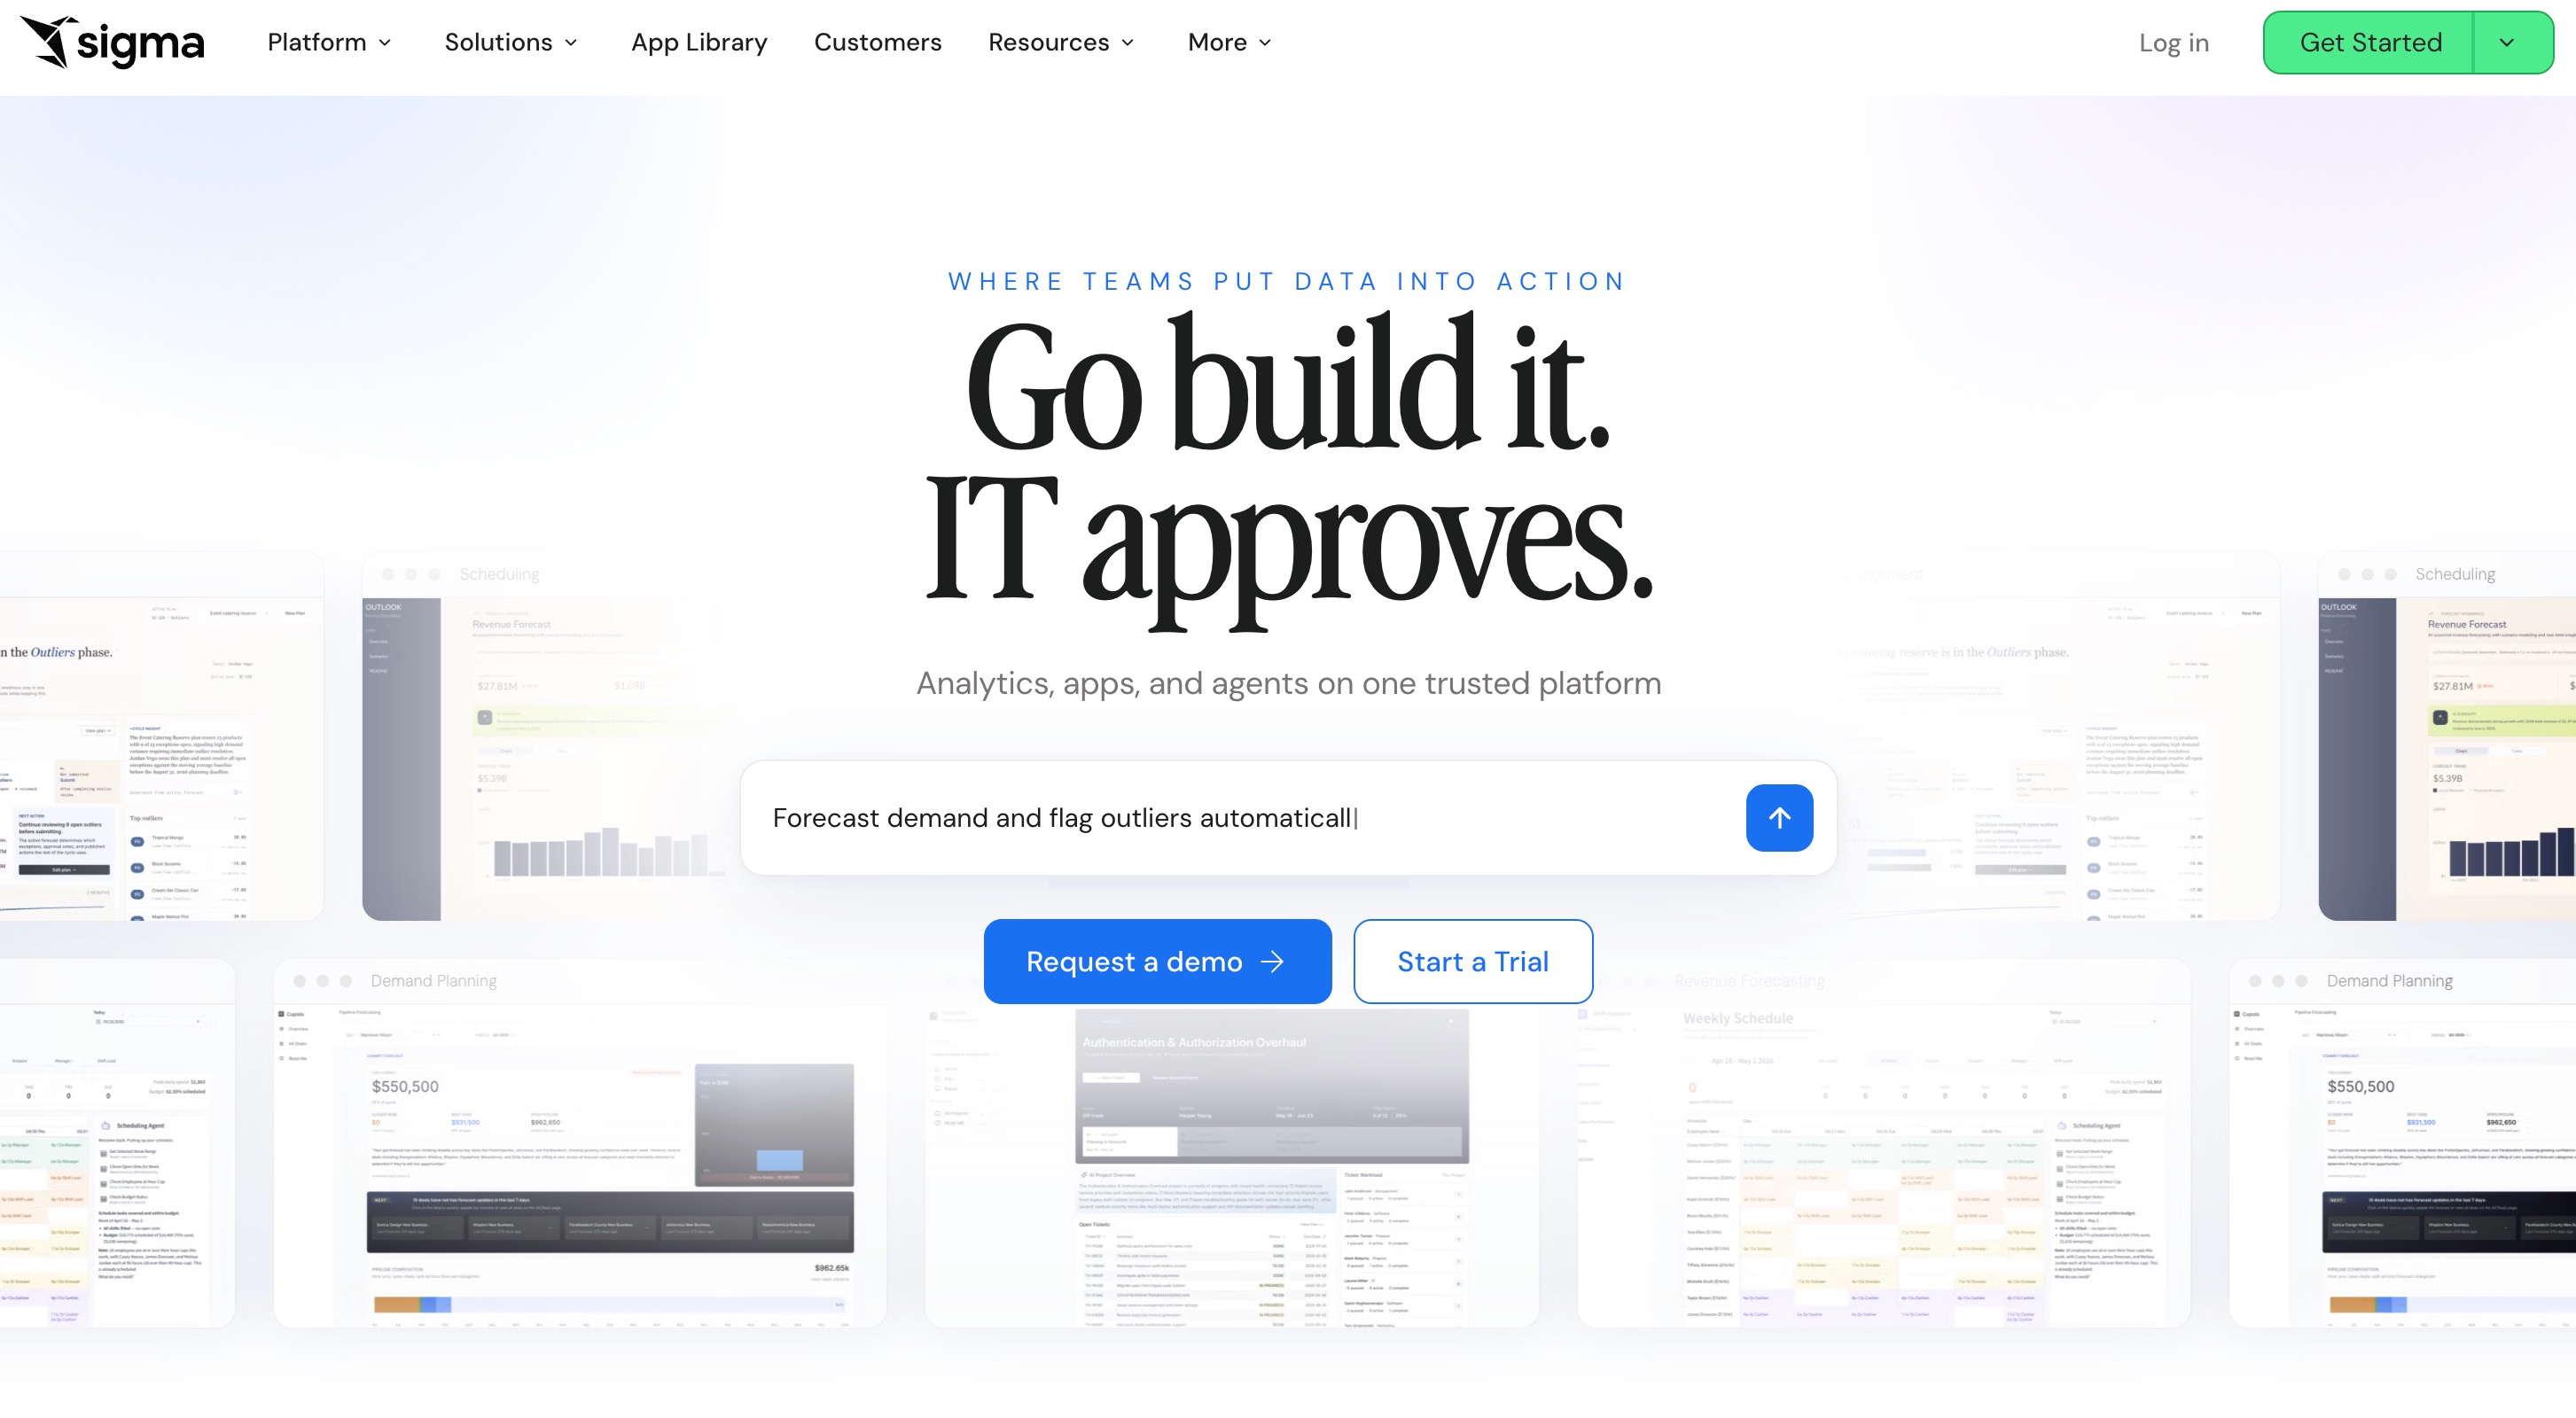
Sigma Computing bridges the gap between cloud data warehouses (like Snowflake) and business users by providing a familiar spreadsheet interface that queries live, massive cloud databases directly.
Key Features
Direct Cloud Querying: No need to extract data; analyze directly in the cloud.
Spreadsheet UI: Looks and feels exactly like traditional spreadsheets.
Scale to Billions: Effortlessly analyze billions of rows in seconds.
Pros
No risk of stale data since it queries live databases.
Familiar UI ensures high user adoption rates.
Highly secure and scalable.
Cons
Requires your company to already have a cloud data warehouse setup.
Enterprise-focused pricing models are prohibitive for individuals.
Pricing
Custom enterprise pricing based on organizational needs.
10. LibreOffice Calc
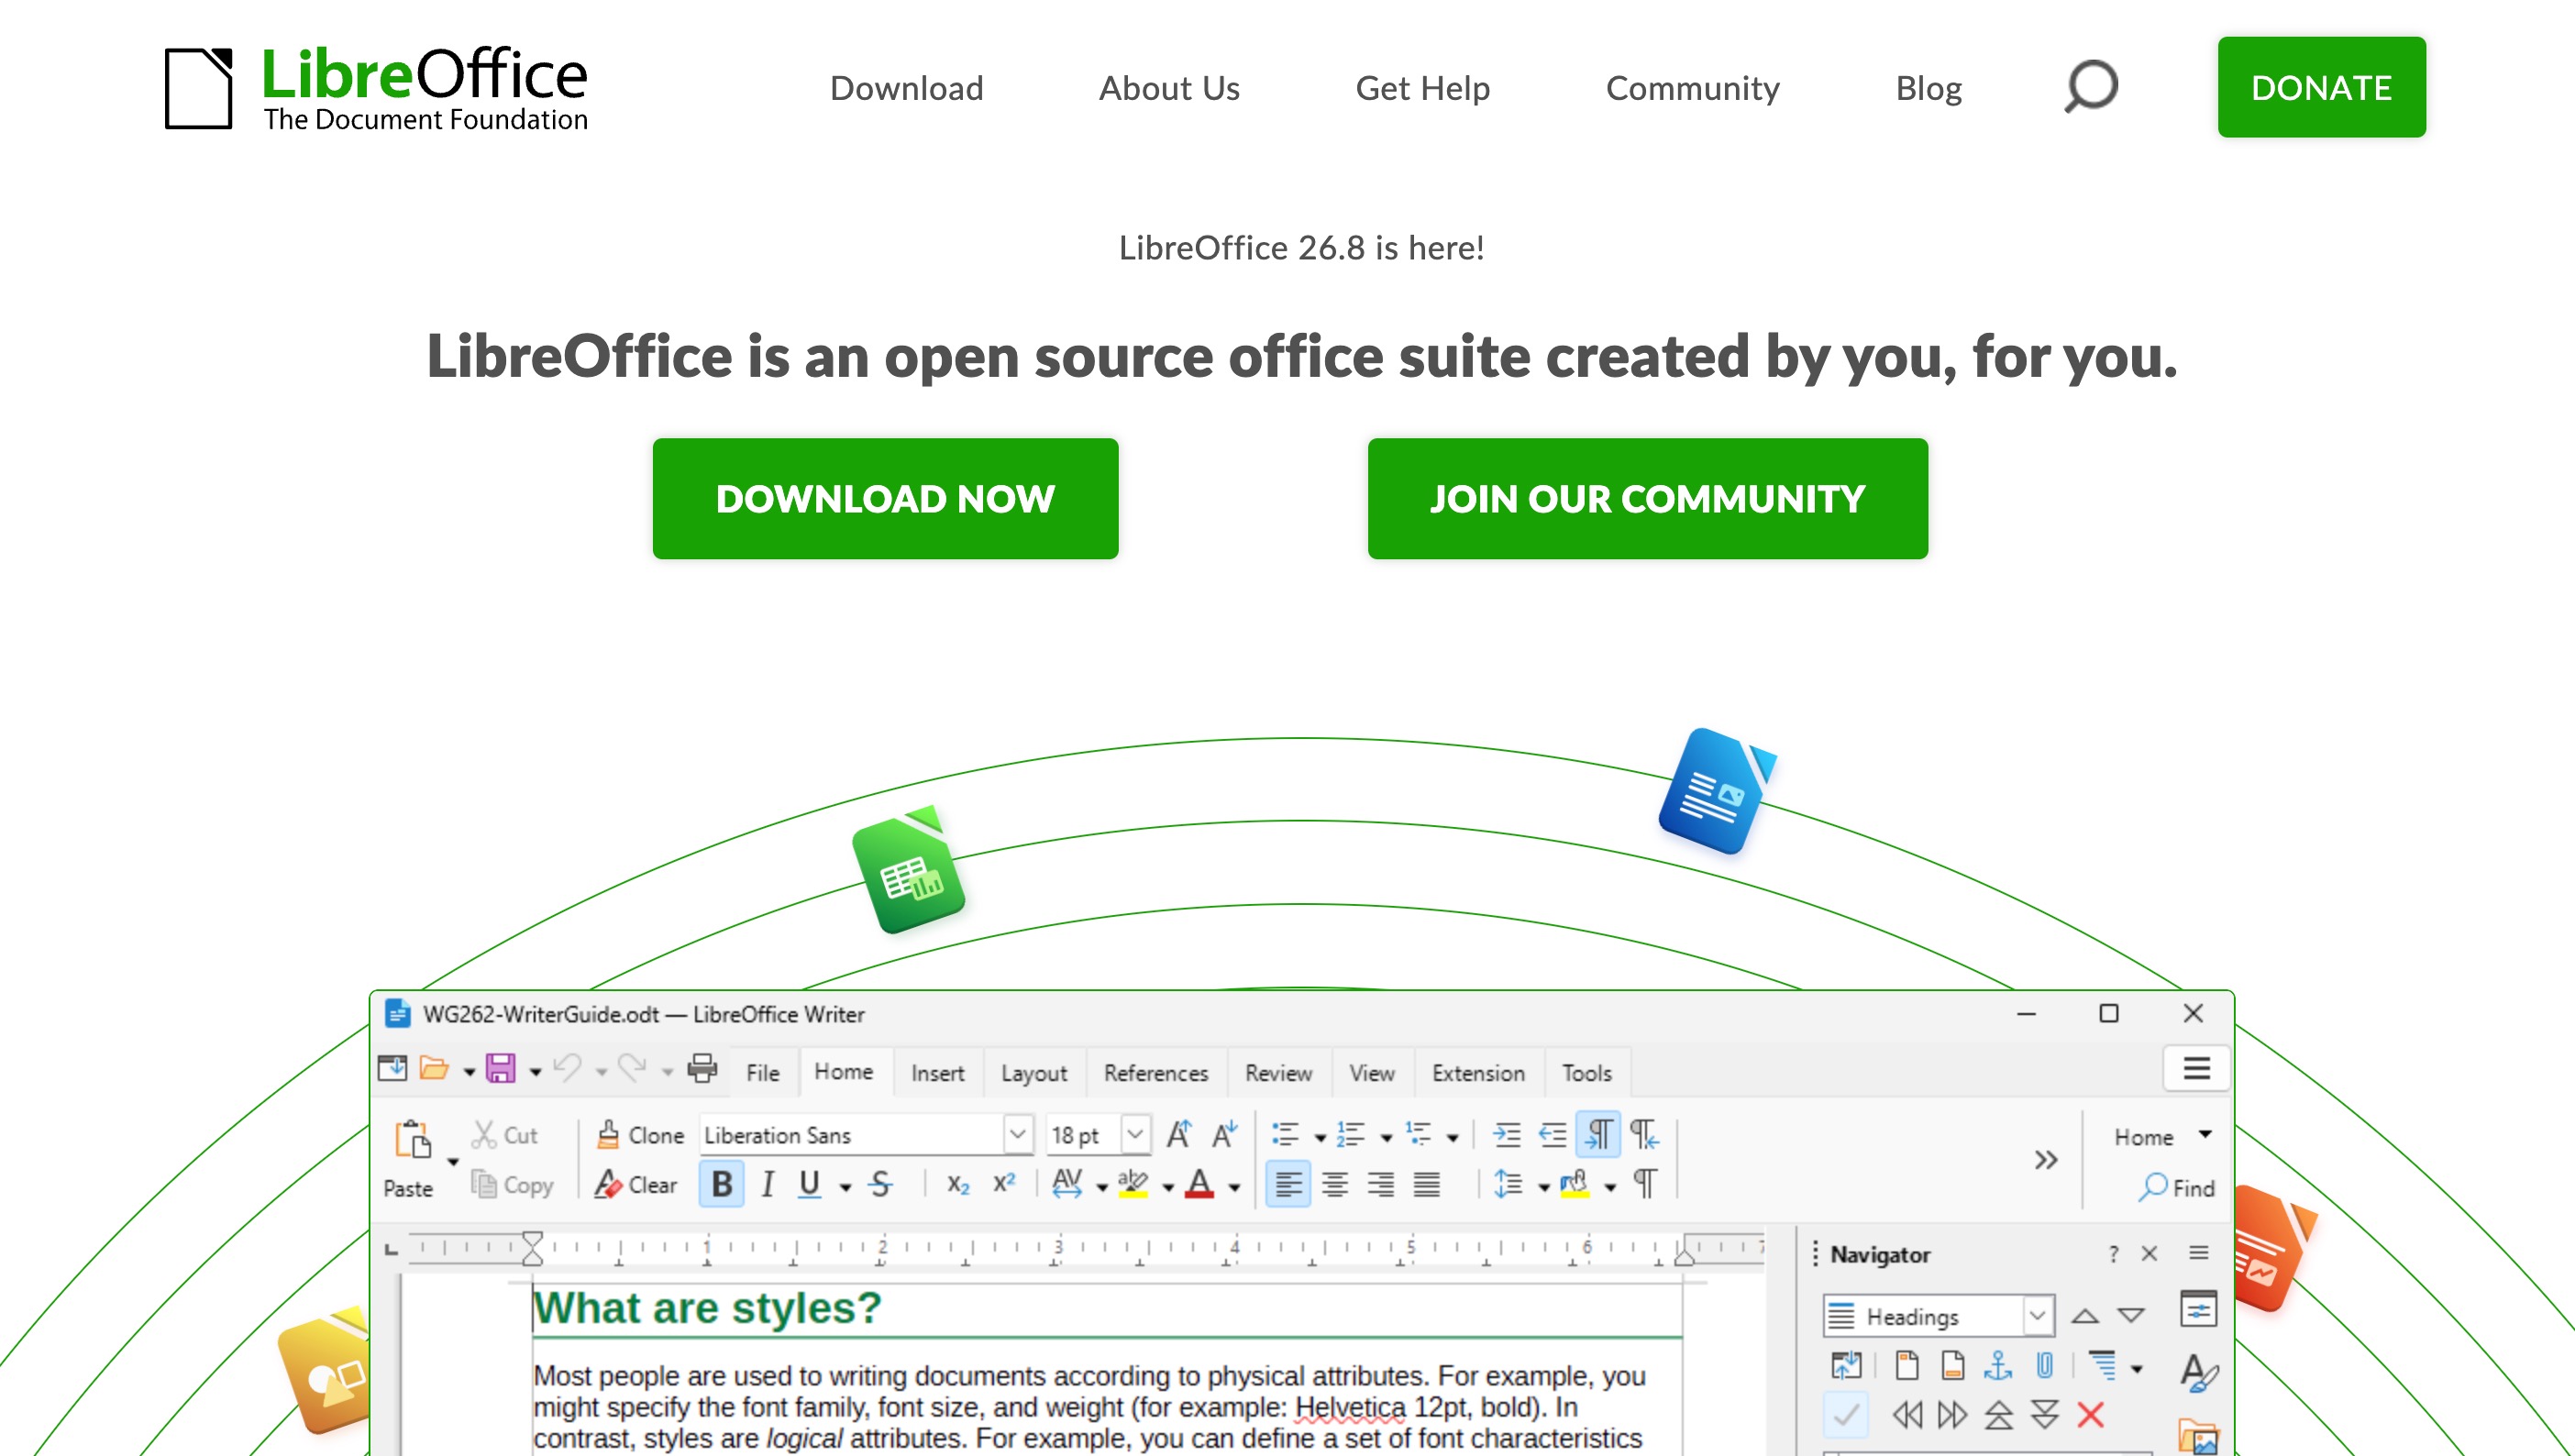
For users looking for a traditional, offline, 100% free alternative to Excel, LibreOffice Calc is the open-source champion. It provides the classic grid experience without requiring any cloud subscriptions.
Key Features
DataPilot: Advanced pivot table technology for raw data manipulation.
High Compatibility: Opens and saves .xlsx formats reliably.
Solver Component: Built-in optimization tools for complex equations.
Pros
Completely free and open-source.
Total offline privacy; your data never touches the cloud.
Highly customizable for traditional power users.
Cons
Dated, clunky user interface.
Zero AI capabilities or modern real-time collaboration.
Pricing
100% Free.
How to Choose the Best Excel Alternative
Choosing the right tool depends entirely on your specific data goals, technical expertise, and operational workflows. Keep these key points in mind:
Assess Your Data Volume: If your analysis involves millions or even billions of rows, a traditional grid-based tool will fail. For this scale, you need to look at dedicated business intelligence platforms like Tableau and Microsoft Power BI, or direct cloud data warehouse query tools like Sigma Computing.
Identify Your Primary Goal: Your end goal dictates the best tool. If you need to create beautiful, embeddable charts for articles or reports, Datawrapper is unmatched. If your work is centered on project management and tracking, Smartsheet is the industry leader. For building flexible, database-like applications without code, Airtable is the ideal choice.
Evaluate Your Technical Skills: Are you a developer or data scientist? A tool like Quadratic that integrates Python and SQL directly into a spreadsheet will feel like a superpower. If you prefer a completely code-free experience, a conversational tool like Julius AI or a drag-and-drop visualizer like Tableau is more appropriate.
Consider Your Entire Workflow (The Powerdrill Bloom Advantage): This is the most crucial factor. While the tools above are excellent at what they do, they are often specialists. Tableau is for visualization. Smartsheet is for project plans. Julius AI is for conversational Q&A. They solve one piece of the puzzle. Powerdrill Bloom is designed to manage the entire workflow. It is the only platform that acts as a persistent AI partner, using its MemoryLake to retain context from the moment you upload raw data, through the analytical process, to the final generation of reports and presentations. It doesn't just answer one-off questions; it participates in the whole project, making it the most holistic and efficient choice for true end-to-end data analysis.
Final Verdict
We are experiencing a major paradigm shift in how we handle data. Excel will always have its place for simple tasks, but forcing it to act as your sole data analysis, visualization, and workflow automation tool is an outdated and inefficient practice. The modern data landscape demands more power, intelligence, and integration.
For professionals who want to maximize efficiency and unlock deeper insights without needing a data science degree, Powerdrill Bloom is the definitive choice. It seamlessly marries the power of advanced AI with practical workflow execution. While other tools specialize in one area, Bloom excels across the entire data lifecycle. By allowing you to chat directly with your files and maintaining long-term context through its persistent Workspaces, it stops being just a piece of software and becomes a dedicated analytical partner. Stop fighting with formulas and crashing files—upgrade to Powerdrill Bloom and let AI turn your data into instant, actionable results.
FAQs
1. Are Excel alternatives secure?
Yes, reputable data analysis platforms use enterprise-grade encryption and comply with global privacy regulations to securely protect your personal information.
2. Can I import Excel files into Powerdrill Bloom?
Absolutely. You can effortlessly upload Excel, CSV, and other text files into the workspace for instant AI-driven data analysis.
3. Is learning a new data tool difficult?
Not necessarily. Modern AI solutions utilize natural language processing, meaning you can analyze complex data through simple conversational prompts.
4. Do I need to know coding for data analysis now?
No. While some technical tools require Python or SQL, many modern platforms provide intuitive, completely code-free artificial intelligence interfaces.
5. Can these alternatives handle large datasets better than Excel?
Yes. Cloud-based alternatives and business intelligence platforms can effortlessly process millions of rows without experiencing the lagging common in Excel.