10 Best Agent Skills for Data Analysis & Reporting in 2026 (Tested & Ranked)
Data analysis is no longer limited to manually cleaning spreadsheets, writing SQL queries, or creating dashboards one chart at a time. Modern AI agents can now support the entire analytics workflow, from inspecting files and preparing messy datasets to calculating metrics, detecting trends, generating visualizations, and transforming insights into presentation-ready reports.
The most valuable AI systems go beyond simple question answering by combining multiple data analysis and reporting skills to complete complex workflows with minimal human intervention. After evaluating workflow coverage, usability, reporting quality, transparency, and export capabilities, Powerdrill Bloom stands out as the best overall AI agent for end-to-end data analysis and reporting.
The Best AI Agent Skills for Data Analysis and Reporting at a Glance
| Rank | AI Agent Skill | Best For | Example Tool |
|---|---|---|---|
| 1 | End-to-End Data Analysis and Reporting | Going from raw files to visual reports | Powerdrill Bloom |
| 2 | Data Cleaning and Preparation | Fixing messy and inconsistent datasets | Alteryx AiDIN |
| 3 | Conversational Data Analysis | Asking questions about data in natural language | ChatGPT Data Analysis, Powerdrill Bloom |
| 4 | Automated Exploratory Data Analysis | Discovering patterns and relationships quickly | Julius AI, Powerdrill Bloom |
| 5 | Dashboard and Visualization Generation | Building business intelligence dashboards | Tableau AI, Powerdrill Bloom |
| 6 | KPI Monitoring and Anomaly Detection | Finding unexpected performance changes | ThoughtSpot |
| 7 | Forecasting and Predictive Analytics | Predicting future outcomes | DataRobot |
| 8 | Code-Assisted Analytics | Combining notebooks, SQL, and AI analysis | Hex Magic |
| 9 | Research and Document Synthesis | Adding external context to reports | Perplexity AI, Powerdrill Bloom |
| 10 | Presentation and Report Generation | Turning findings into business narratives | Gamma, Powerdrill Bloom |
What Are AI Agent Skills for Data Analysis and Reporting?
AI agent skills are specialized capabilities that allow an AI system to complete specific parts of an analytics workflow.
For example:
A data preparation skill cleans inconsistent values and missing records.
An analysis skill calculates metrics and identifies patterns.
A visualization skill recommends and creates appropriate charts.
A forecasting skill predicts future performance.
A reporting skill converts findings into summaries, presentations, or dashboards.
A monitoring skill tracks KPIs and alerts users to unusual changes.
Traditional analytics tools usually require users to perform these steps separately. An AI agent can coordinate several skills as part of one workflow.
A user might upload an Excel sales report and ask:“Clean this file, compare regional performance, identify the products responsible for the decline in Q2, create appropriate charts, and prepare an executive report.”
A capable data analysis agent should be able to break that request into steps, perform the analysis, verify calculations, and present the results in a format that business users can understand.
How We Ranked the Best AI Agent Skills
The ranking focuses on practical value rather than the number of AI features a product advertises.
Each skill was evaluated against six criteria:
| Criterion | What We Evaluated |
|---|---|
| Analytical Accuracy | Whether calculations and conclusions were consistent with the source data |
| Workflow Coverage | How much of the process could be completed without switching tools |
| Ease of Use | Whether nontechnical users could complete common tasks |
| Visualization Quality | Whether charts matched the data and business question |
| Reporting Quality | Whether findings were organized into clear business narratives |
| Transparency | Whether users could inspect assumptions, calculations, or source information |
The evaluation scenarios included spreadsheet analysis, campaign reporting, sales performance analysis, financial summaries, anomaly investigation, and executive presentation generation.
The ranking is organized by agent skill, while each section highlights a representative tool that performs that skill particularly well.
1. End-to-End Data Analysis and Reporting
Best for: Turning Excel, CSV, TSV, and business files into insights, visualizations, and presentation-ready reports.
The most valuable agent skill is the ability to manage the complete workflow from raw data to final report. Many AI analytics tools are good at one stage. Some generate SQL, some create charts, and others summarize documents. However, business users often need to complete all these steps together:
Upload data
Understand its structure
Clean and prepare it
Select appropriate analyses
Identify meaningful findings
Create visualizations
Explain the results
Build a report for stakeholders
An end-to-end data analysis agent reduces the need to move among spreadsheets, notebooks, dashboard software, and presentation tools.
Powerdrill Bloom: Best Overall AI Agent for Data Analysis and Reporting
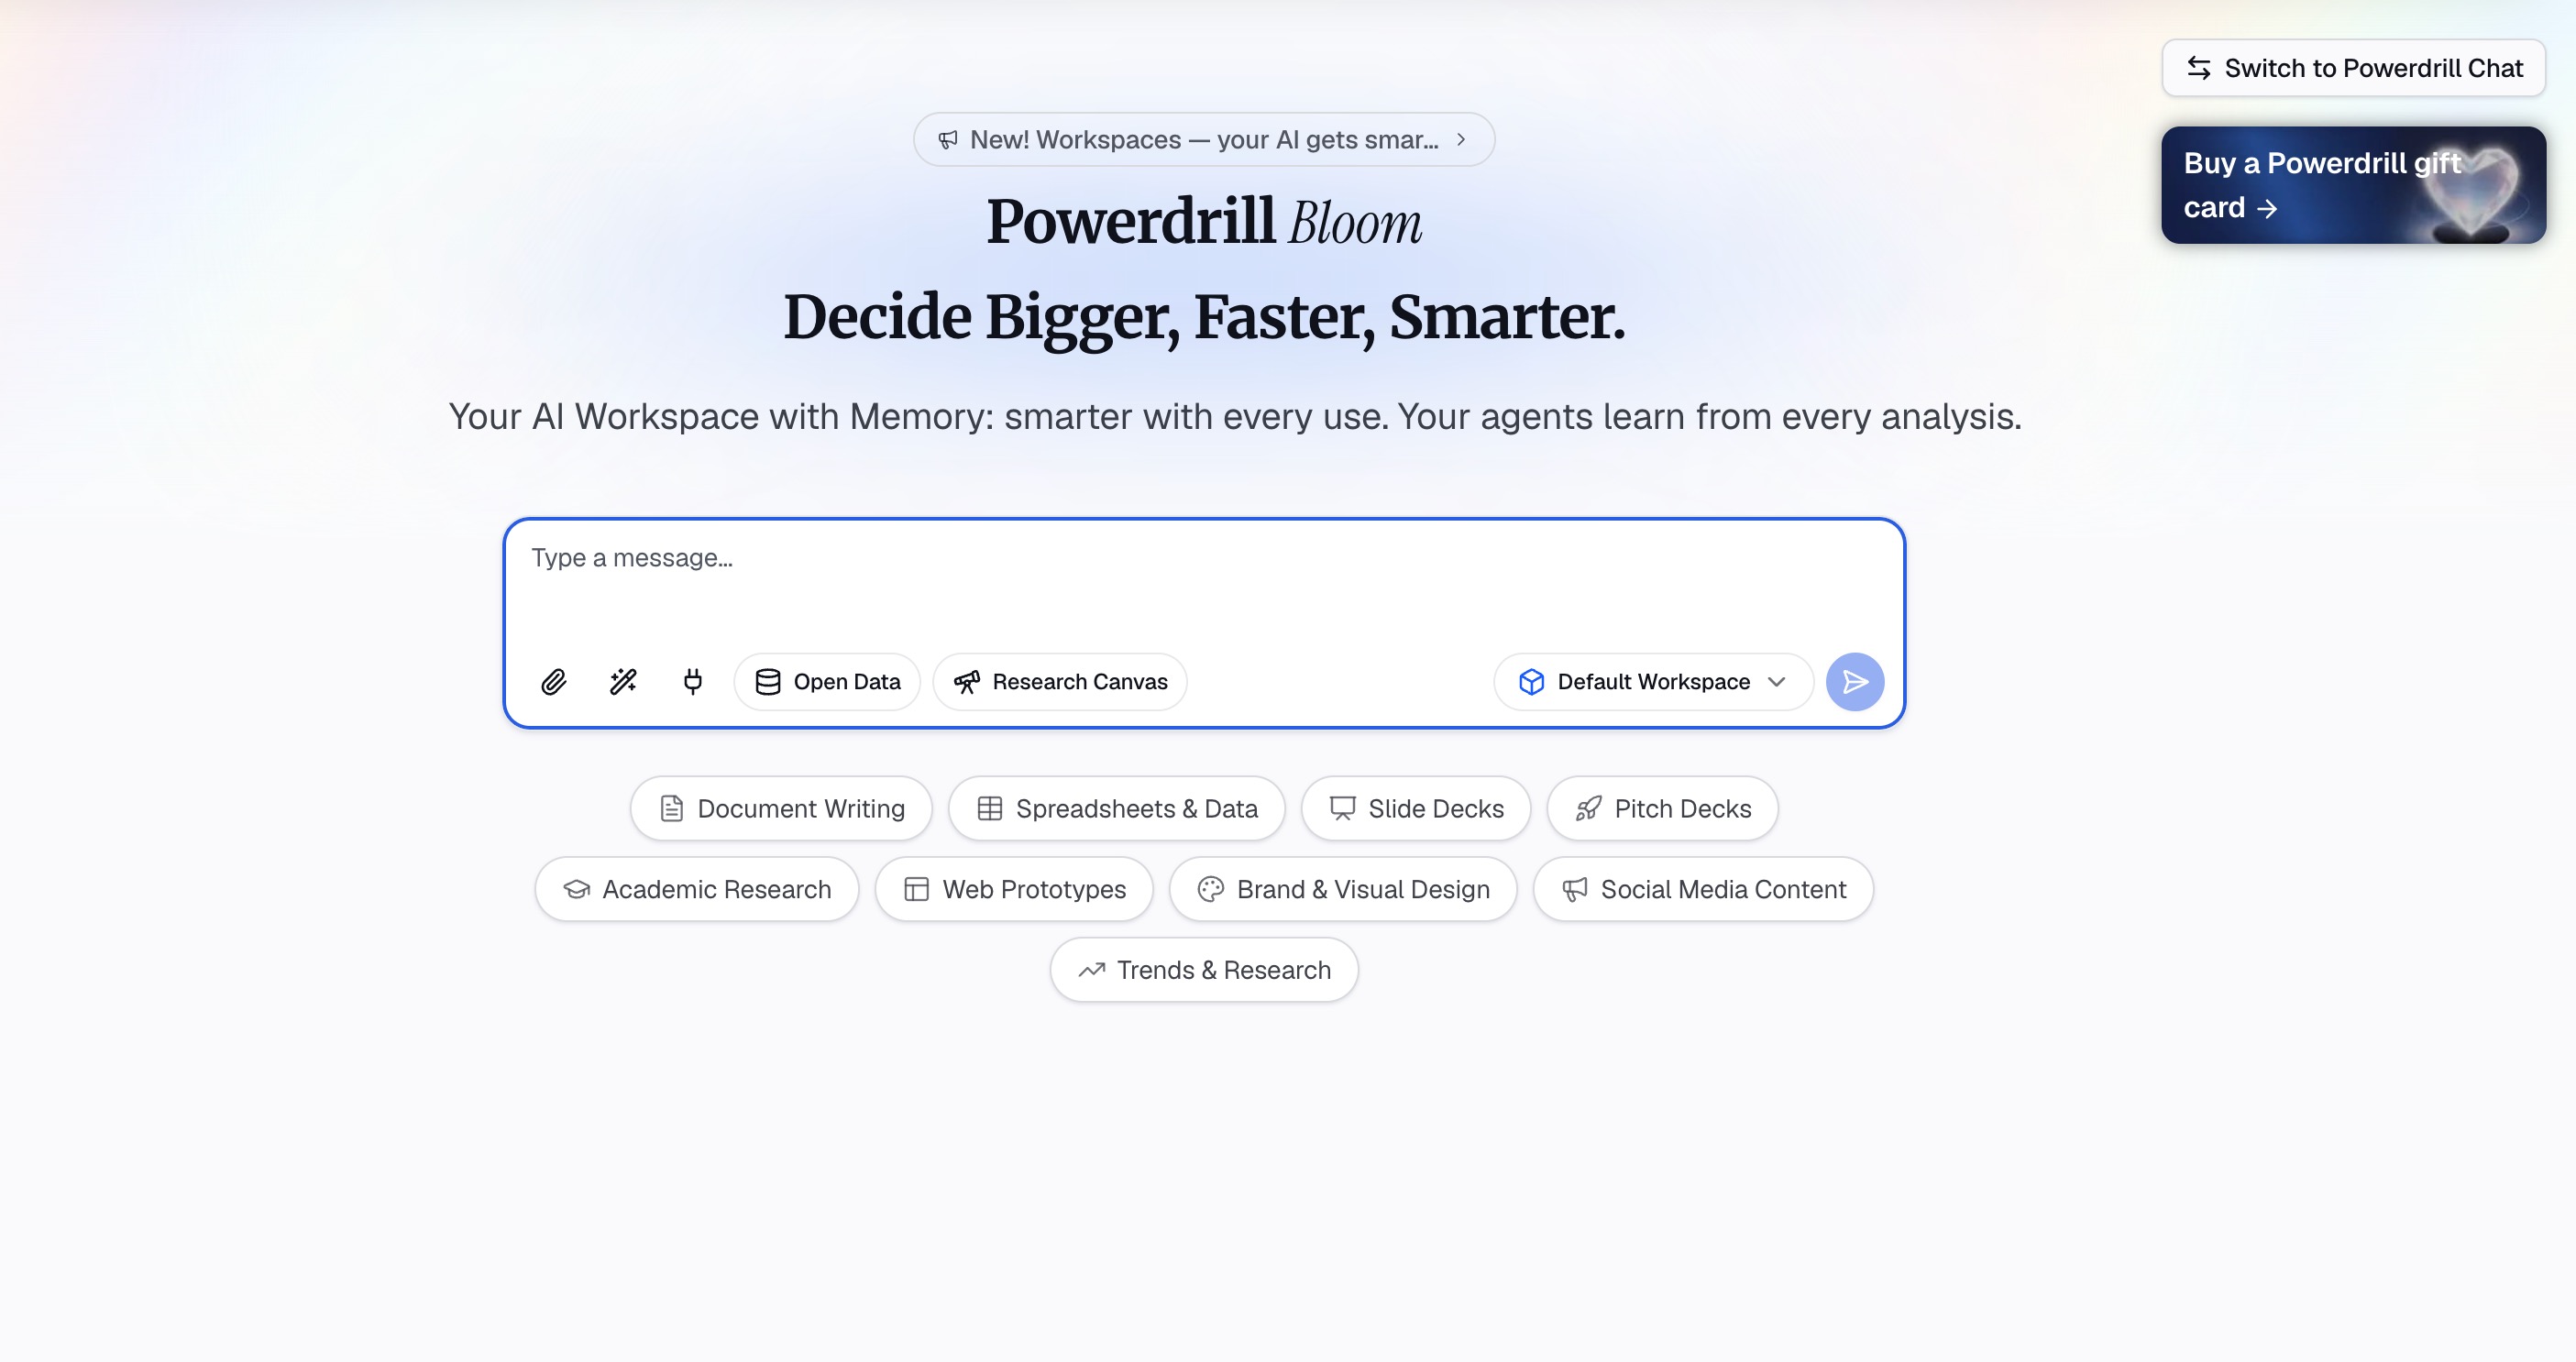
Powerdrill Bloom is a general-purpose AI agent with a strong focus on data-driven workflows.
Instead of requiring users to write formulas, SQL, or Python, Bloom allows them to upload business files and analyze the information through natural-language instructions. It can help users move from raw datasets to visual analysis and business-ready reporting in one environment.
Powerdrill Bloom can help users:
Upload and analyze common business file formats
Clean and prepare spreadsheet data
Explore datasets automatically
Identify trends, patterns, and anomalies
Calculate business metrics and comparisons
Recommend suitable charts
Build visual analysis canvases
Generate written explanations of findings
Turn analysis into presentation-ready reports
Export results for use in PowerPoint or Notion workflows
Why Powerdrill Bloom Ranks First
Bloom ranks first because it combines several of the most important agent skills in a connected workflow.
A user does not have to know the exact statistical method or chart type before beginning. Bloom can inspect the dataset, suggest analysis directions, and help organize the results into a coherent business narrative.
This makes it particularly useful for nontechnical professionals who need more than a chatbot response but do not want to build a traditional BI pipeline.
Example Workflow
Suppose a sales manager uploads a workbook containing monthly sales by region, product, and sales representative.
The user can ask Bloom to:
Check the file for missing or inconsistent values
Calculate revenue growth by region
Compare actual sales with targets
Identify the products responsible for declining performance
Detect unusual monthly changes
Create relevant charts
Summarize the most important findings
Produce an executive report
Instead of completing each task manually in Excel and PowerPoint, the user can manage the workflow through one AI agent.
Key Use Cases
| Use Case | How Powerdrill Bloom Helps |
|---|---|
| Sales Analysis | Identifies revenue trends, product performance, and regional differences |
| Marketing Reporting | Analyzes campaign results, conversion rates, and customer behavior |
| Financial Analysis | Turns financial spreadsheets into summaries and visual reports |
| Operations Reporting | Finds bottlenecks, unusual changes, and performance gaps |
| Customer Analytics | Discovers segments, usage trends, and retention patterns |
| Executive Reporting | Converts detailed analysis into concise visual narratives |
| Spreadsheet Automation | Reduces manual formulas, chart creation, and formatting |
Limitations
Bloom can accelerate analysis, but users should still validate important calculations and conclusions, especially for financial, regulatory, or high-risk decisions.
It is best viewed as an AI data analyst that assists with preparation, exploration, visualization, and reporting—not as a replacement for data governance or expert review.
Pricing
Paid plans were advertised from approximately $13.27 per month at the time of writing. Check the Powerdrill website for current pricing and plan limits.
2. Data Cleaning and Preparation
Best for: Fixing messy datasets before analysis.
Data preparation is often the most time-consuming part of analytics. Business data frequently contains:
Missing values
Duplicate rows
Inconsistent date formats
Incorrect data types
Different naming conventions
Unnecessary columns
Outliers and invalid records
Information spread across multiple files
If these issues are not corrected, even a well-designed analysis can produce misleading results. A data preparation agent should be able to inspect a dataset, identify quality problems, recommend transformations, and apply approved changes.
Alteryx AiDIN: AI-Assisted Data Preparation
Alteryx combines data preparation, analytics, and automation features for enterprise workflows. Its AI capabilities help users design transformations, create analytical workflows, and work with data through more accessible interfaces.
Alteryx can help teams:
Combine information from multiple sources
Identify data quality problems
Standardize fields and formats
Remove duplicate records
Prepare datasets for analytics or machine learning
Automate recurring preparation workflows
Document data transformations
Key Use Cases
| Use Case | How the Skill Helps |
|---|---|
| CRM Data Cleanup | Standardizes customer names, locations, and account information |
| Financial Consolidation | Combines data from multiple departments or entities |
| Marketing Operations | Merges campaign data from different platforms |
| Supply Chain Analysis | Prepares inventory and logistics records |
| Recurring Reports | Automates repeated data preparation steps |
3. Conversational Data Analysis
Best for: Asking questions about datasets in natural language.
Conversational analysis allows users to explore data without writing formulas or code. Instead of manually creating a pivot table, a user can ask:
Which products grew the fastest?
Why did customer acquisition cost increase?
What percentage of revenue came from repeat customers?
Are there significant differences among regions?
Which variables appear to be related to churn?
A conversational agent should understand the question, choose an analytical approach, perform the calculation, and explain the result.
ChatGPT Data Analysis: Flexible Natural-Language Analysis
ChatGPT’s data analysis capabilities can work with uploaded files, write and execute Python, create charts, and explain analytical results.
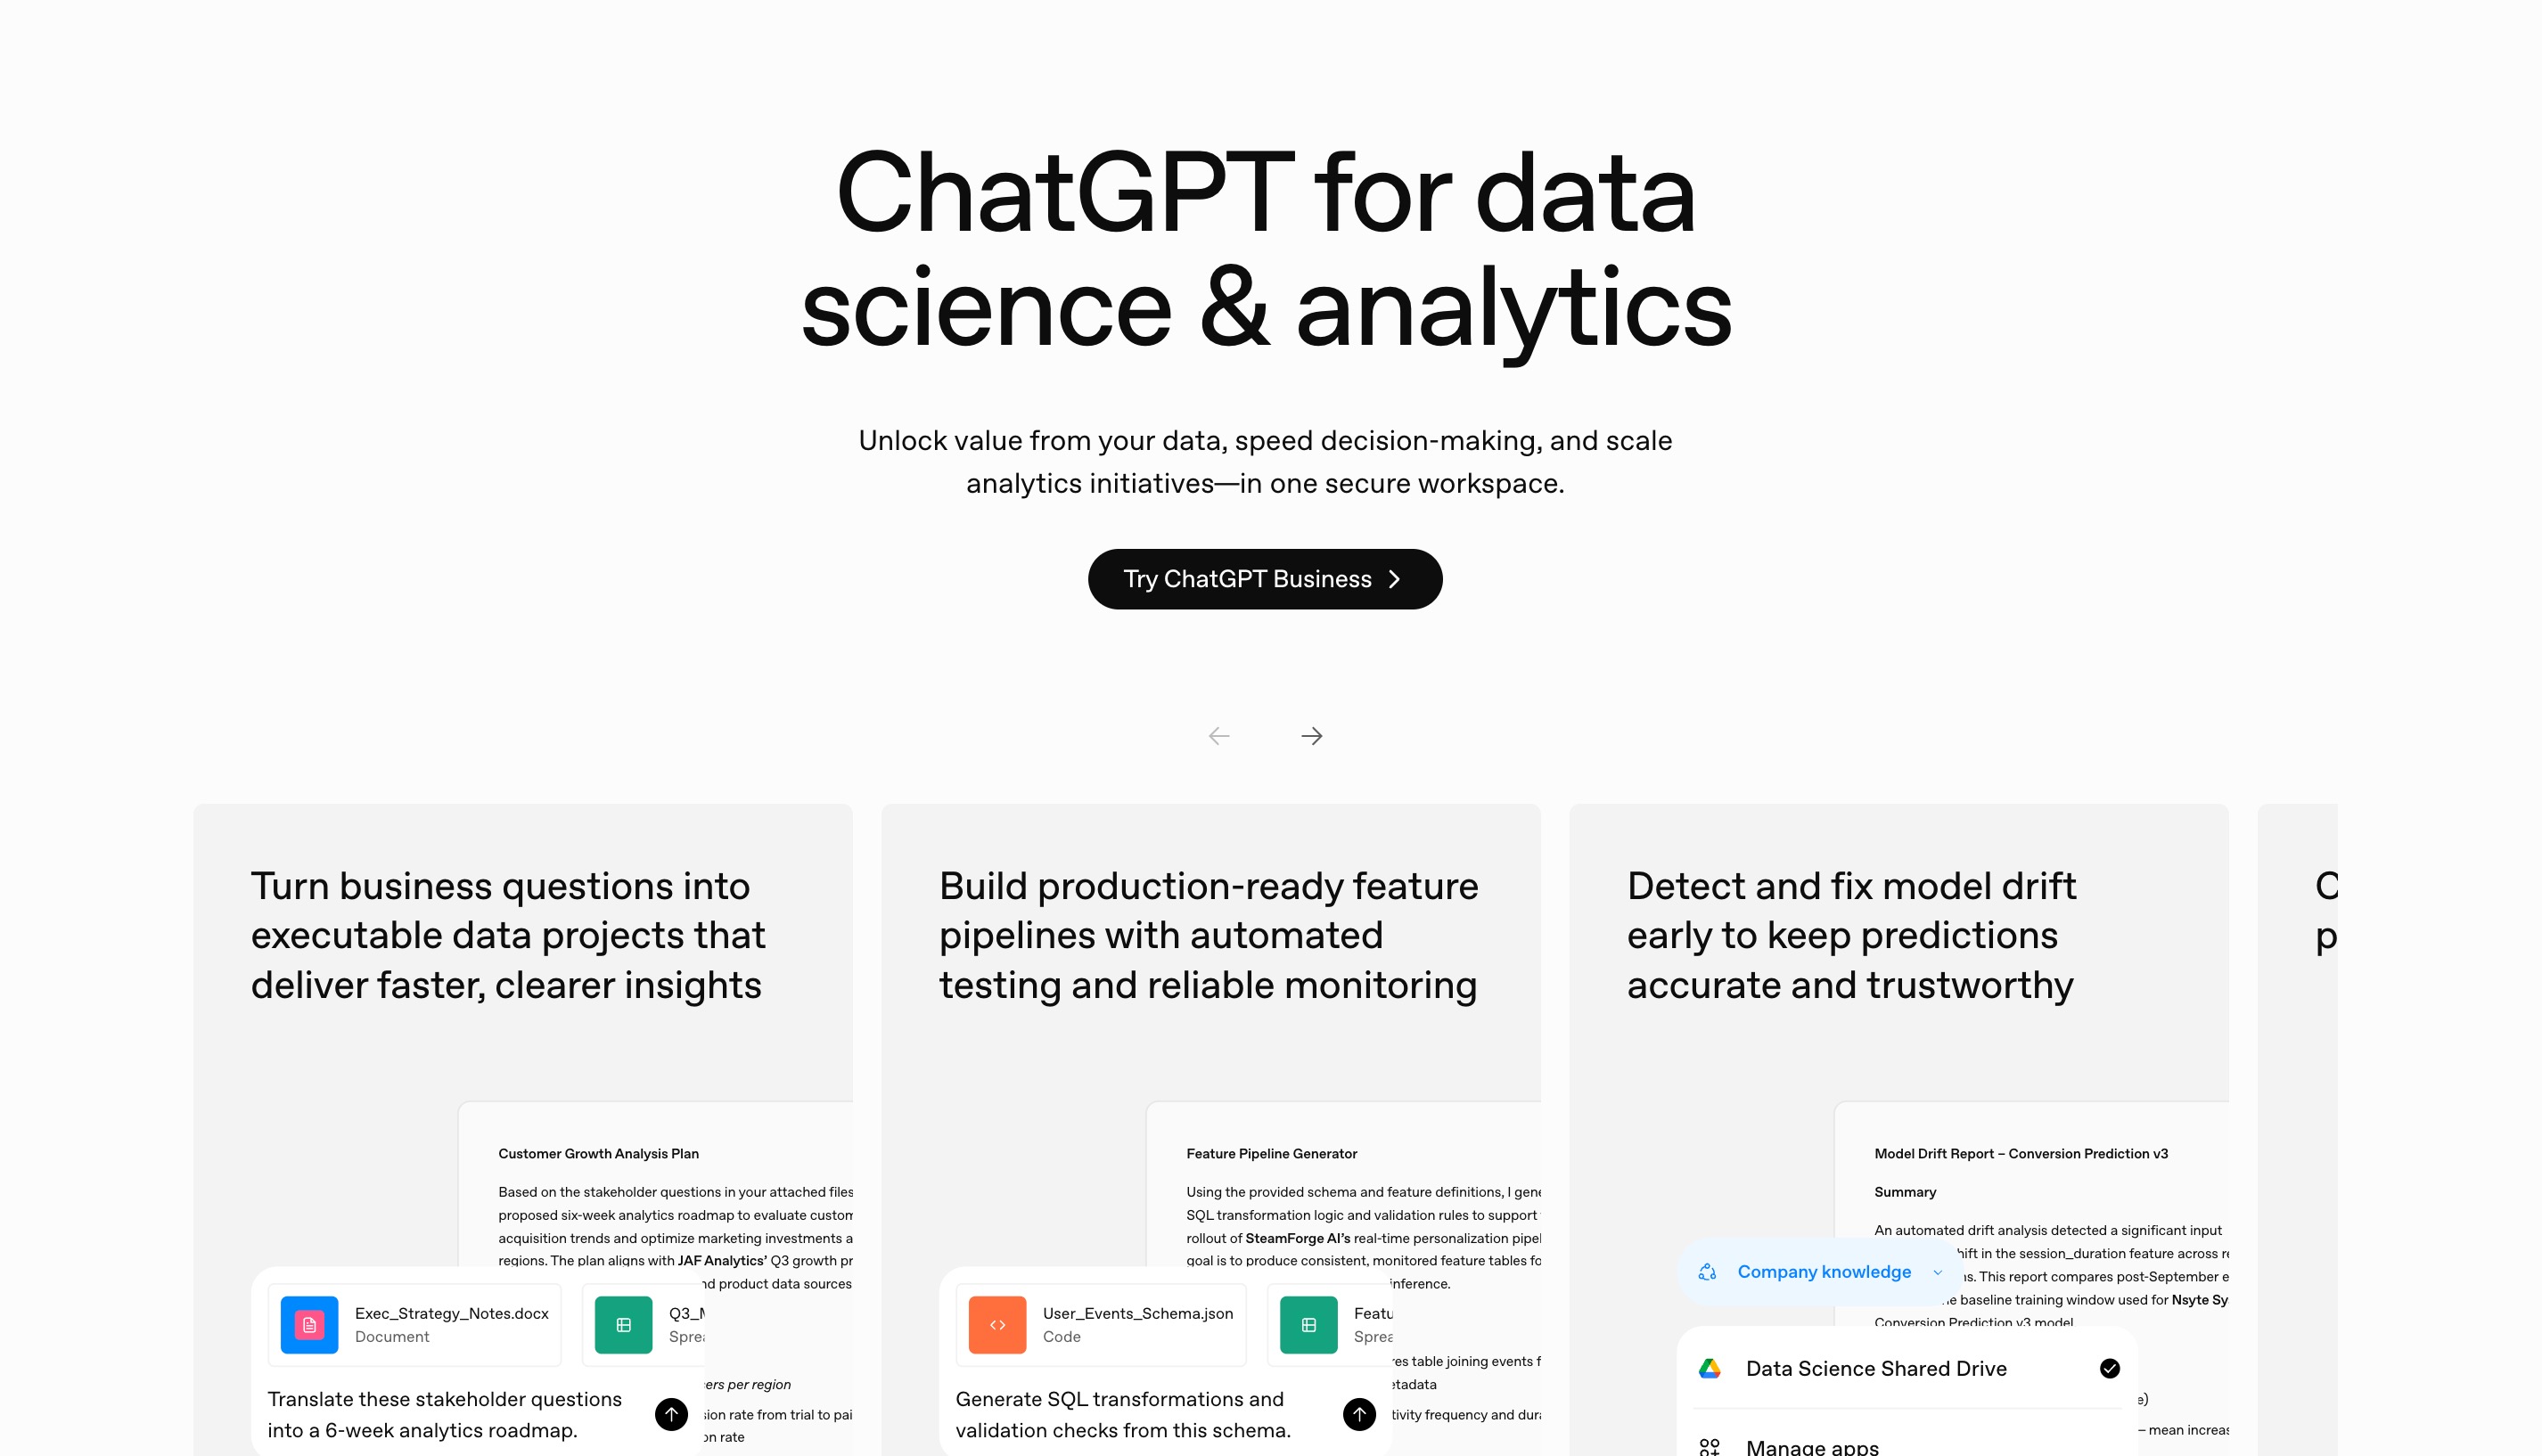
It is particularly useful for open-ended questions where the user wants to iterate quickly.
ChatGPT can help users:
Inspect spreadsheet and CSV files
Calculate metrics
Generate Python code
Create basic visualizations
Perform statistical tests
Explain analytical concepts
Explore follow-up questions conversationally
Key Use Cases
| Use Case | How ChatGPT Helps |
|---|---|
| Ad Hoc Analysis | Answers one-time questions about uploaded datasets |
| Statistical Analysis | Performs correlations, regressions, and significance tests |
| Code Generation | Creates Python or SQL for analytical tasks |
| Data Explanation | Explains calculations in accessible language |
| Chart Creation | Generates visualizations from uploaded data |
Limitations
Conversational flexibility does not always produce a structured reporting workflow. Users may need to organize outputs manually, verify that the correct columns were used, and move results into another tool for final presentation.
Choose ChatGPT for flexible exploration and coding support. Choose Powerdrill Bloom when the priority is a more guided path from uploaded data to visual business reporting.
4. Automated Exploratory Data Analysis
Best for: Quickly discovering patterns, relationships, and potential questions.
Exploratory data analysis, or EDA, helps analysts understand a dataset before building a final report or model. An EDA agent can automatically examine:
Column distributions
Missing values
Correlations
Category frequencies
Outliers
Time-based trends
Potential relationships among variables
This skill is useful when users have a dataset but do not yet know which questions to ask.
Julius AI: Conversational Exploratory Analysis
Julius AI is designed to help users analyze spreadsheets and structured data through natural-language interactions. Users can upload a dataset and ask Julius to investigate trends, generate visualizations, or perform statistical analysis. Julius AI can help with:

Dataset exploration
Descriptive statistics
Correlation analysis
Chart creation
Statistical modeling
Trend identification
Natural-language explanations
Key Use Cases
| Use Case | How Julius AI Helps |
|---|---|
| Survey Analysis | Examines response distributions and relationships |
| Customer Analysis | Finds behavioral patterns and customer segments |
| Academic Data | Performs statistical exploration without extensive coding |
| Sales Analysis | Identifies performance trends and correlations |
| Operational Data | Finds unusual values and recurring patterns |
5. Dashboard and Visualization Generation
Best for: Turning governed business data into interactive dashboards.
Charts are not valuable simply because they look attractive. A good visualization must match the analytical question.
For example:
Line charts are useful for time trends.
Bar charts support category comparisons.
Scatter plots reveal relationships.
Waterfall charts explain changes.
Maps display geographic patterns.
KPI cards highlight performance against targets.
A visualization agent should recommend appropriate chart types, avoid misleading scales, and organize information into a usable dashboard.
Tableau AI: AI-Assisted Business Intelligence
Tableau provides visual analytics and dashboard capabilities for organizations that need interactive business intelligence. Its AI-assisted features can help users explore data, create calculations, build visualizations, and explain changes in business metrics.
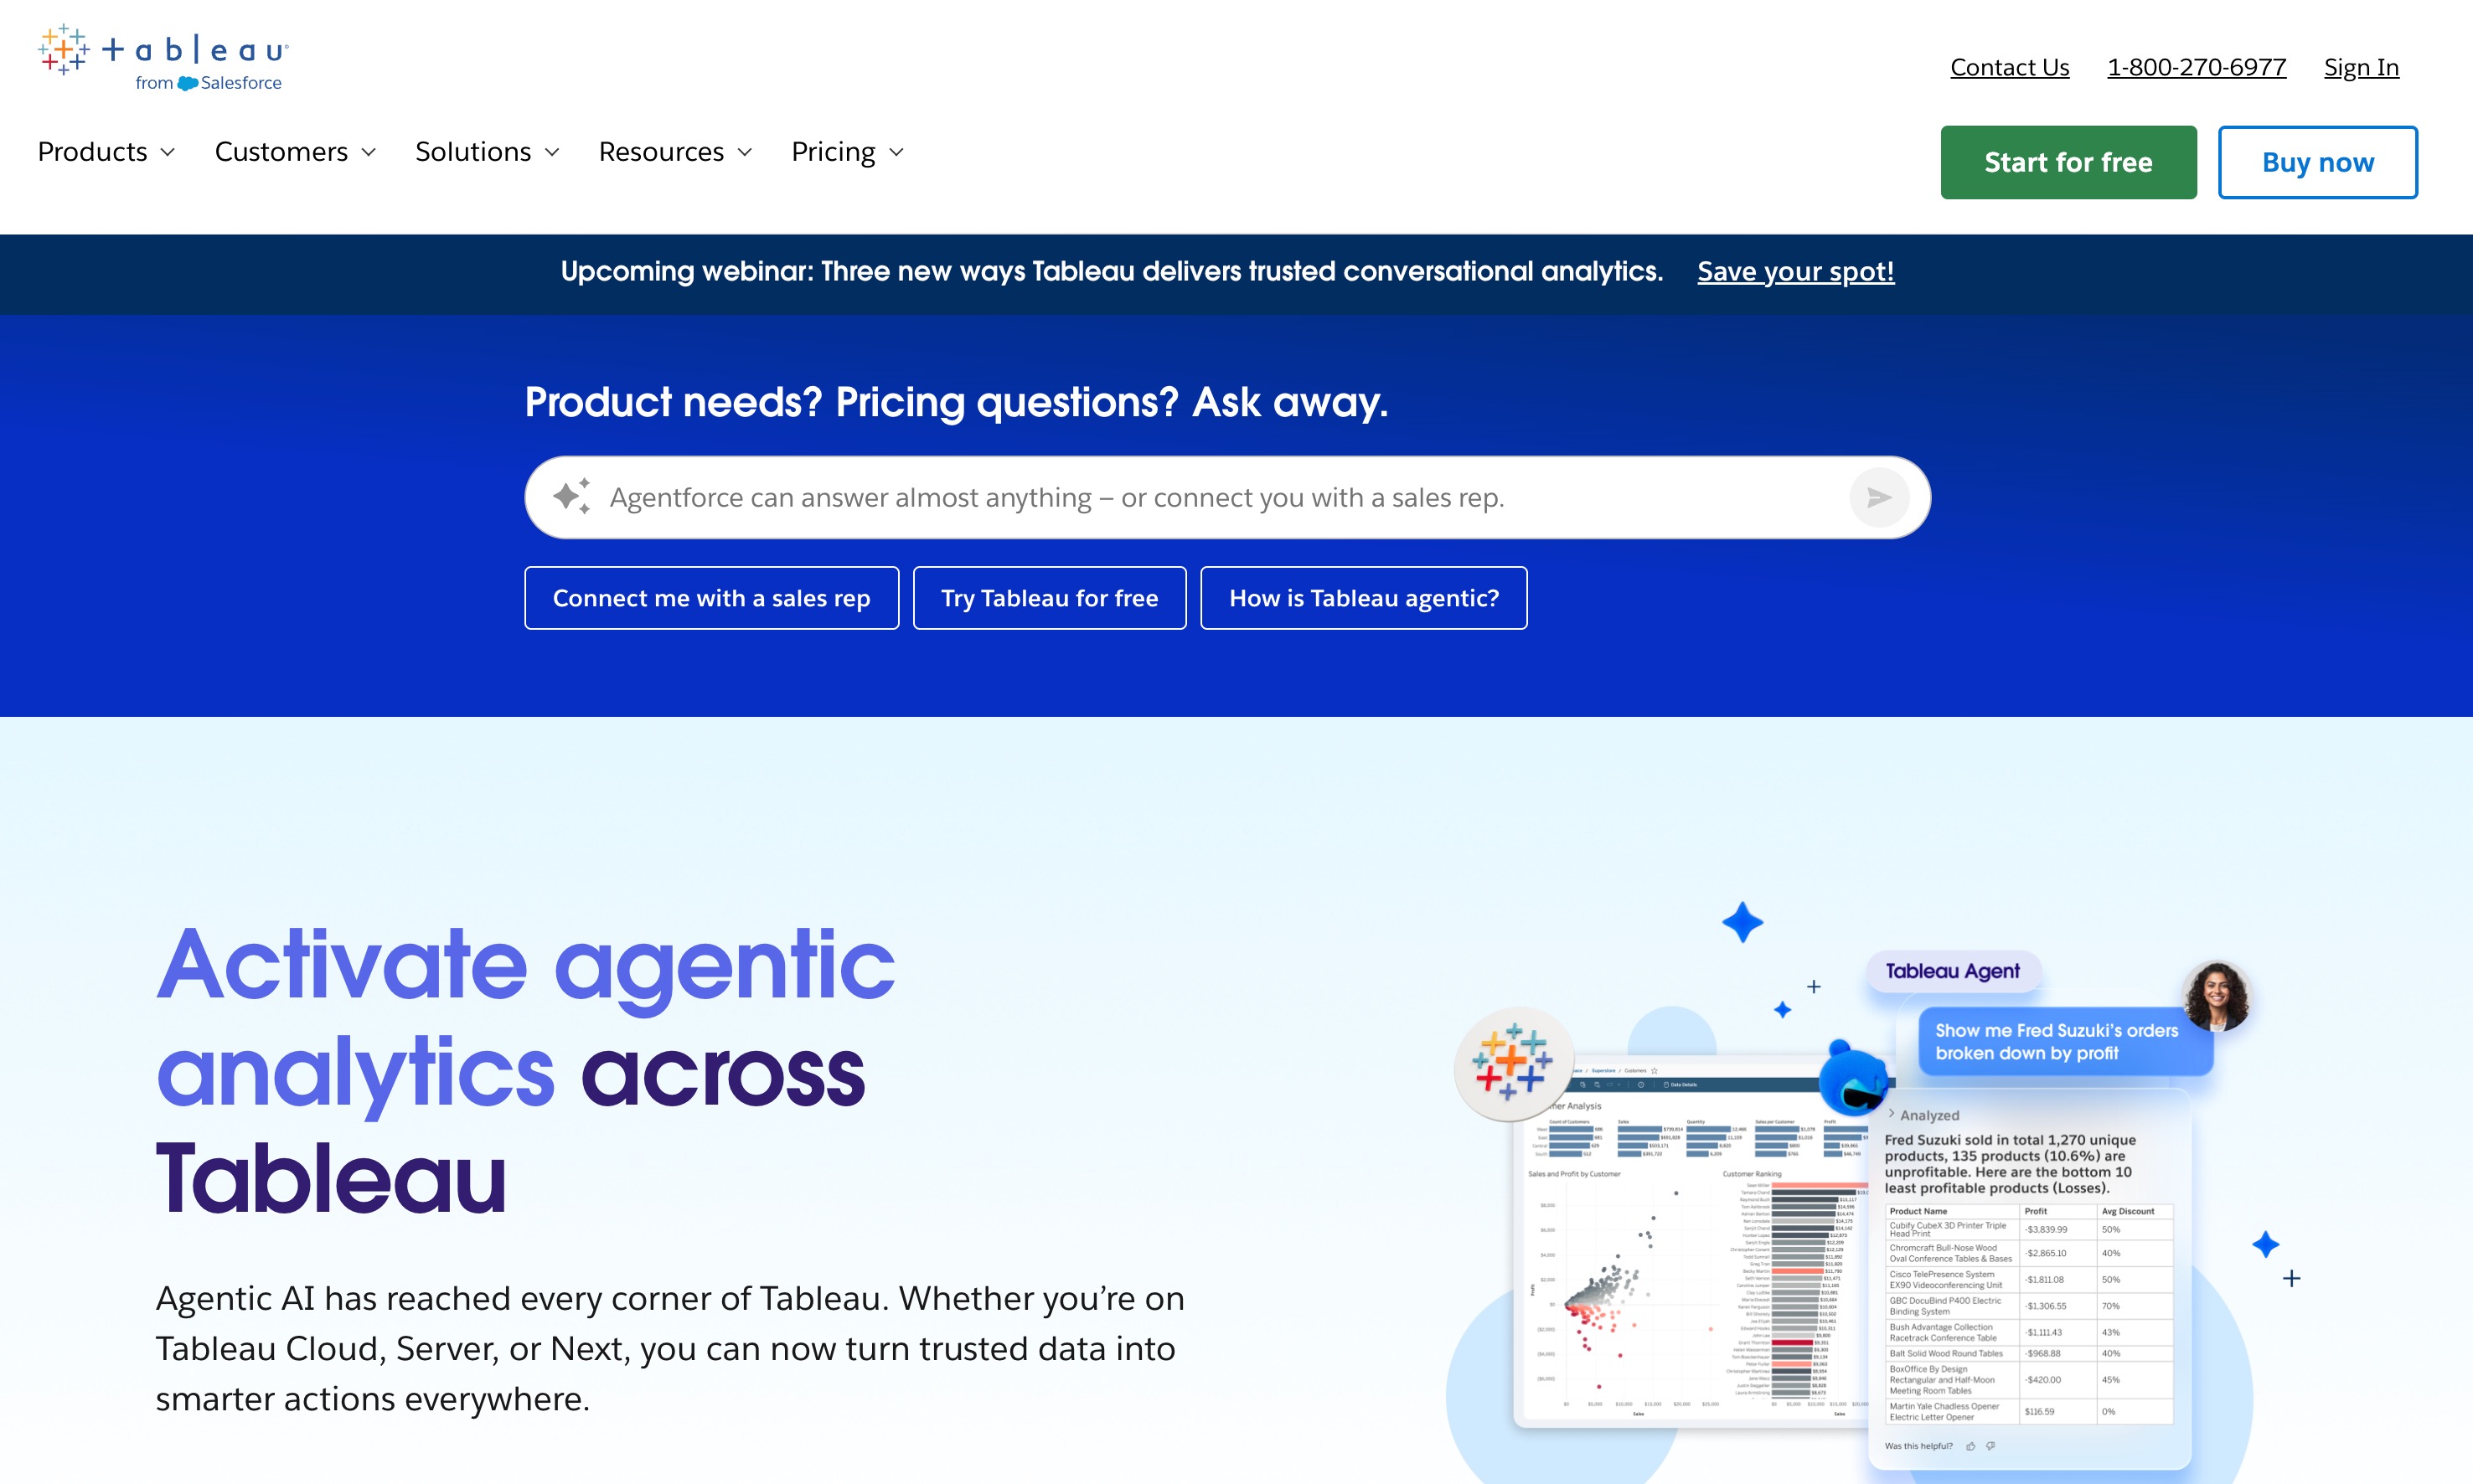
Tableau can support:
Interactive dashboards
Natural-language data exploration
Calculated field generation
KPI monitoring
Visual explanations
Enterprise data connections
Governed analytics environments
Key Use Cases
| Use Case | How Tableau Helps |
|---|---|
| Executive Dashboards | Tracks organizational KPIs |
| Sales Performance | Compares products, territories, and teams |
| Financial Monitoring | Displays budgets, actuals, and variances |
| Operations Analytics | Monitors efficiency and service performance |
| Enterprise BI | Shares governed dashboards across departments |
Limitations
Tableau is powerful, but building and maintaining an enterprise BI environment may require data modeling, governance, and administrative resources.
For recurring, interactive dashboards connected to enterprise systems, Tableau is a strong choice. For fast analysis of uploaded business files and presentation-ready reports, Bloom offers a lighter end-to-end experience.
6. KPI Monitoring and Anomaly Detection
Best for: Detecting unusual changes in business performance.
Business users cannot manually inspect every metric every day. Anomaly detection agents continuously examine data and notify users when something changes unexpectedly.
Examples include:
A sudden decline in conversion rate
An unexpected increase in refund volume
A drop in revenue from one region
Unusually high customer acquisition costs
Inventory changes outside the normal range
A product performing differently from historical patterns
The best systems do more than flag the anomaly. They help users investigate the possible cause.
ThoughtSpot: AI-Powered Analytics Monitoring
ThoughtSpot is designed to provide conversational analytics and proactive insights from business data. It can help users monitor metrics, ask follow-up questions, and investigate the factors behind performance changes.
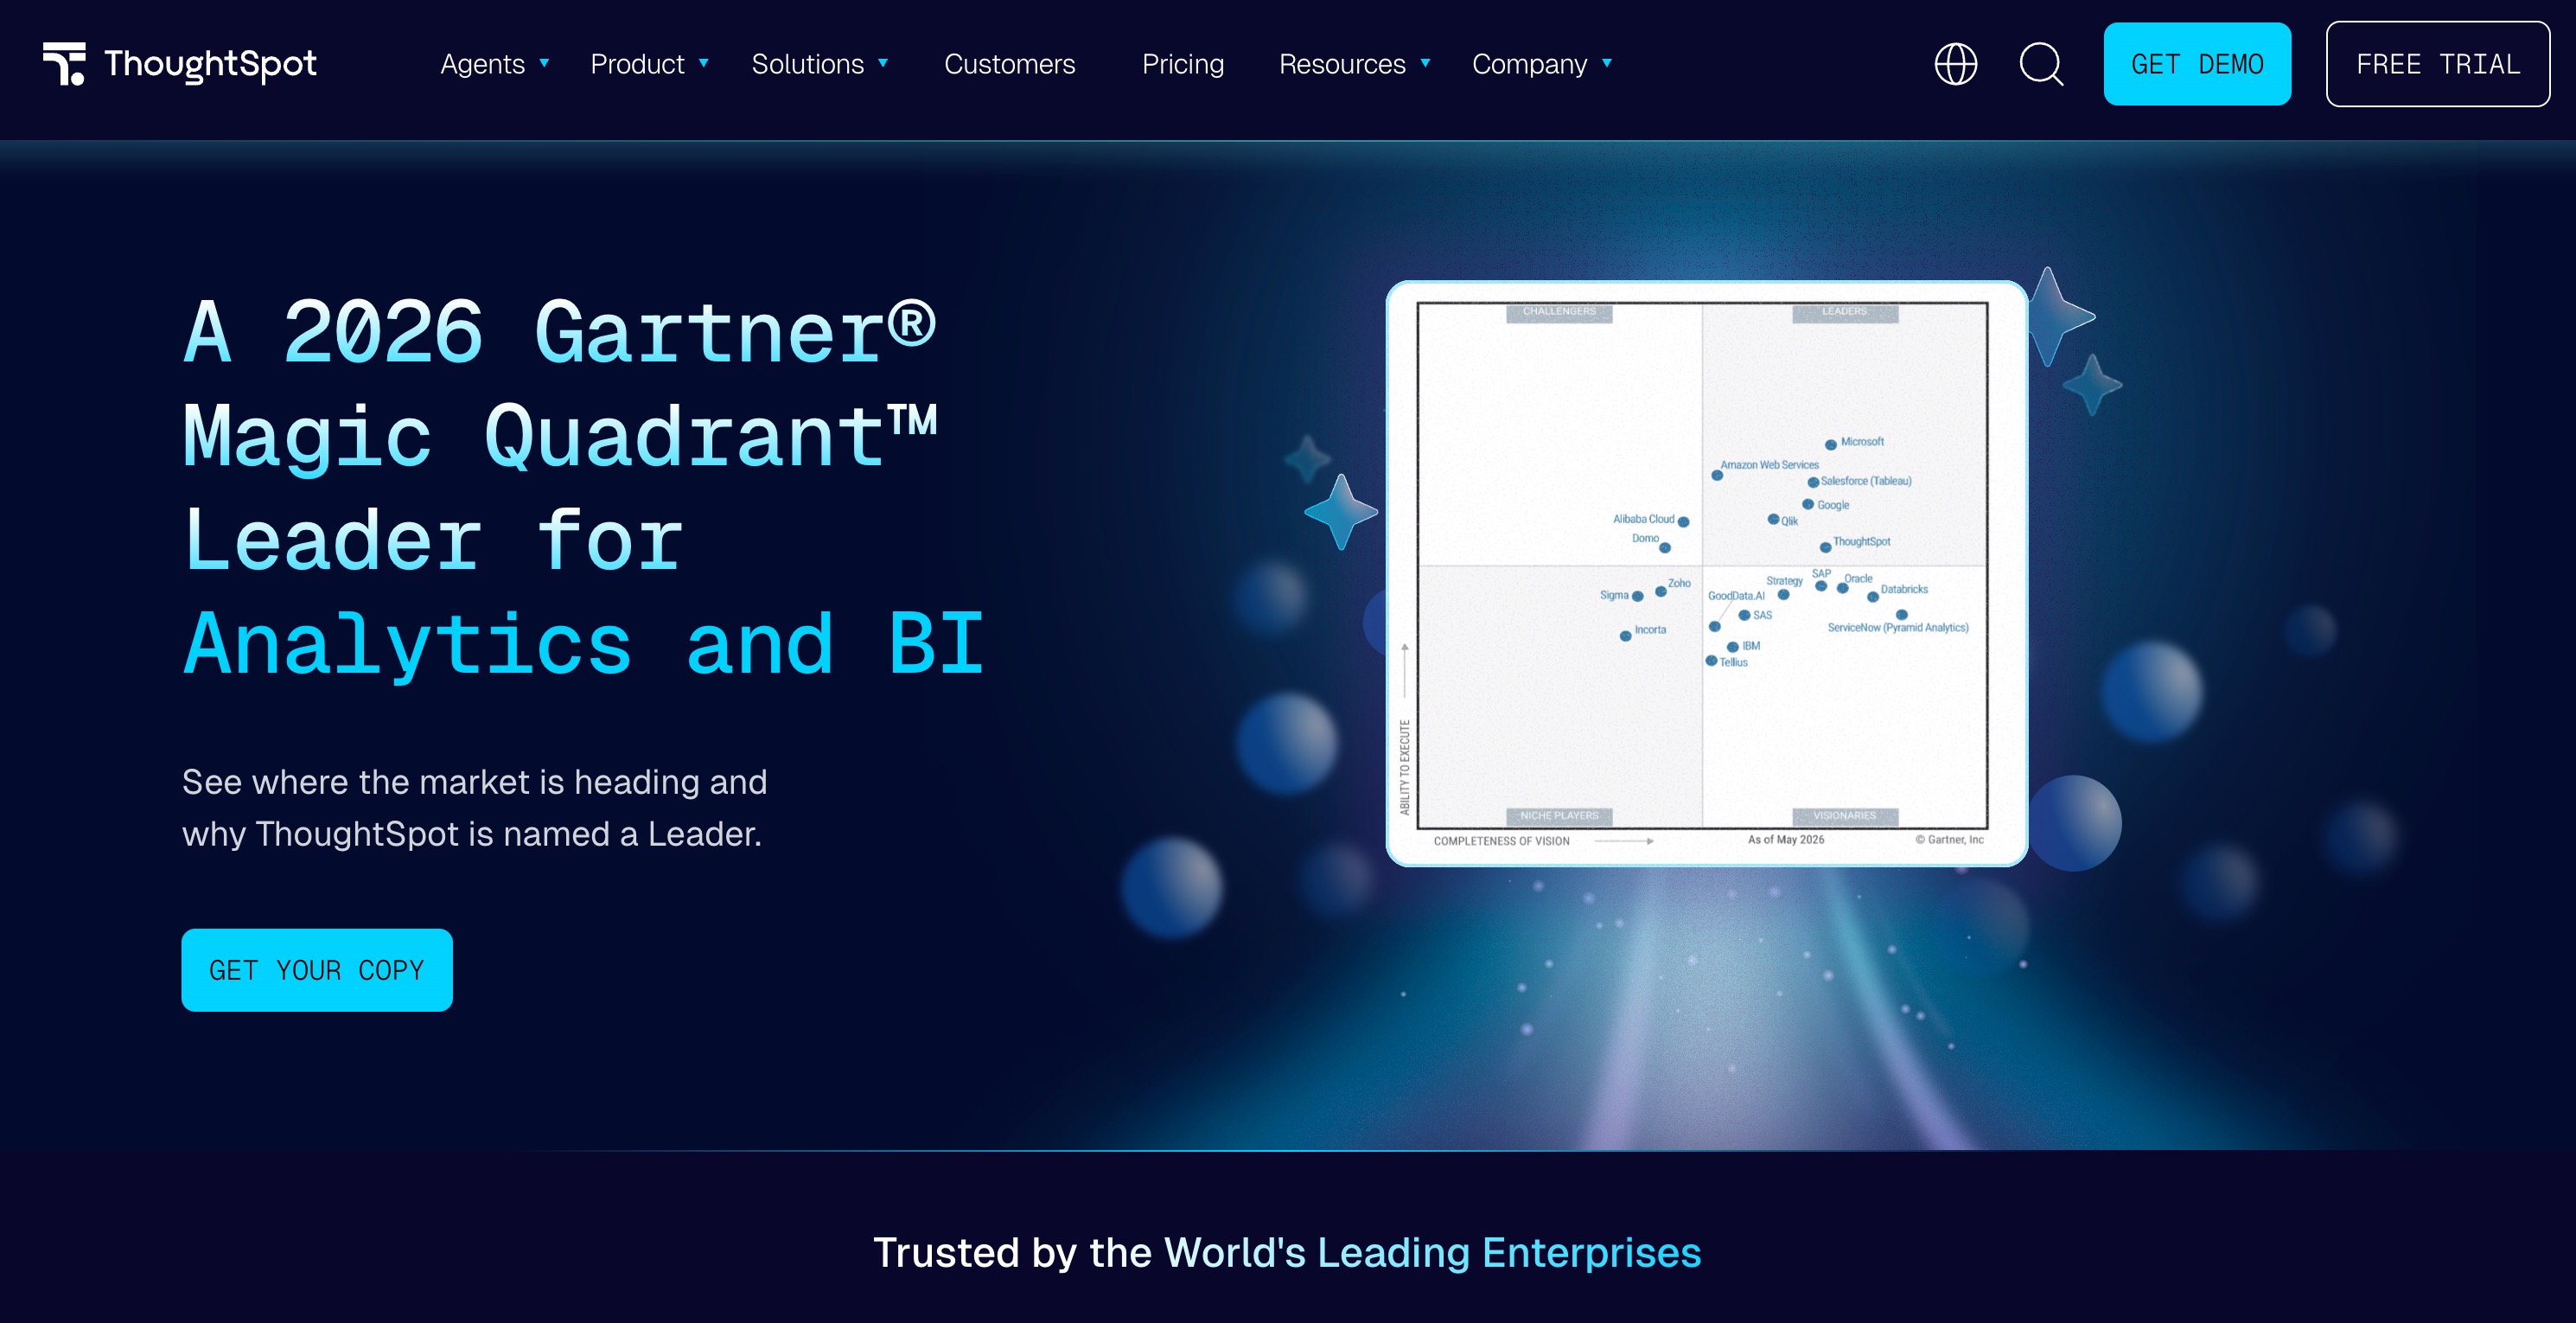
Its capabilities include:
Natural-language business questions
KPI monitoring
Automated insights
Anomaly identification
Root-cause exploration
Personalized analytical experiences
Key Use Cases
| Use Case | How ThoughtSpot Helps |
|---|---|
| Revenue Monitoring | Detects unexpected sales changes |
| Marketing Analytics | Flags changes in campaign performance |
| Product Analytics | Identifies unusual usage patterns |
| Customer Success | Monitors retention and account health |
| Operations | Finds performance deviations quickly |
7. Forecasting and Predictive Analytics
Best for: Predicting future business outcomes.
Descriptive reporting tells users what happened. Predictive analytics estimates what may happen next. A forecasting agent can help answer questions such as:
What will revenue look like next quarter?
Which customers are at risk of churning?
How much inventory will be needed?
Which leads are most likely to convert?
What is the expected impact of a price change?
Modern AI agents can automate parts of feature selection, model comparison, validation, and explanation.
DataRobot: Enterprise Predictive Analytics
DataRobot provides automated machine learning and predictive AI capabilities for organizations that need to build and manage analytical models.
It can assist with:
Forecasting
Classification
Regression
Model comparison
Feature analysis
Model monitoring
Prediction explanations
Key Use Cases
| Use Case | How DataRobot Helps |
|---|---|
| Demand Forecasting | Predicts future product demand |
| Churn Prediction | Identifies customers likely to leave |
| Risk Analysis | Estimates financial or operational risks |
| Lead Scoring | Prioritizes likely sales opportunities |
| Maintenance Planning | Predicts equipment failures |
8. Code-Assisted Analytics
Best for: Analysts who want AI support without giving up SQL, Python, or notebooks.
Some users want a no-code experience. Others need direct control over queries, transformations, and models. Code-assisted analytics combines the flexibility of notebooks with AI-generated SQL, Python, explanations, and debugging. This skill is valuable for data analysts and analytics engineers who need to:
Query warehouses
Transform large datasets
Reuse analytical logic
Collaborate with technical teams
Validate calculations
Build reproducible reports
Hex Magic: Collaborative AI Analytics
Hex combines notebooks, SQL, Python, data applications, and AI-assisted analytics in a collaborative environment.
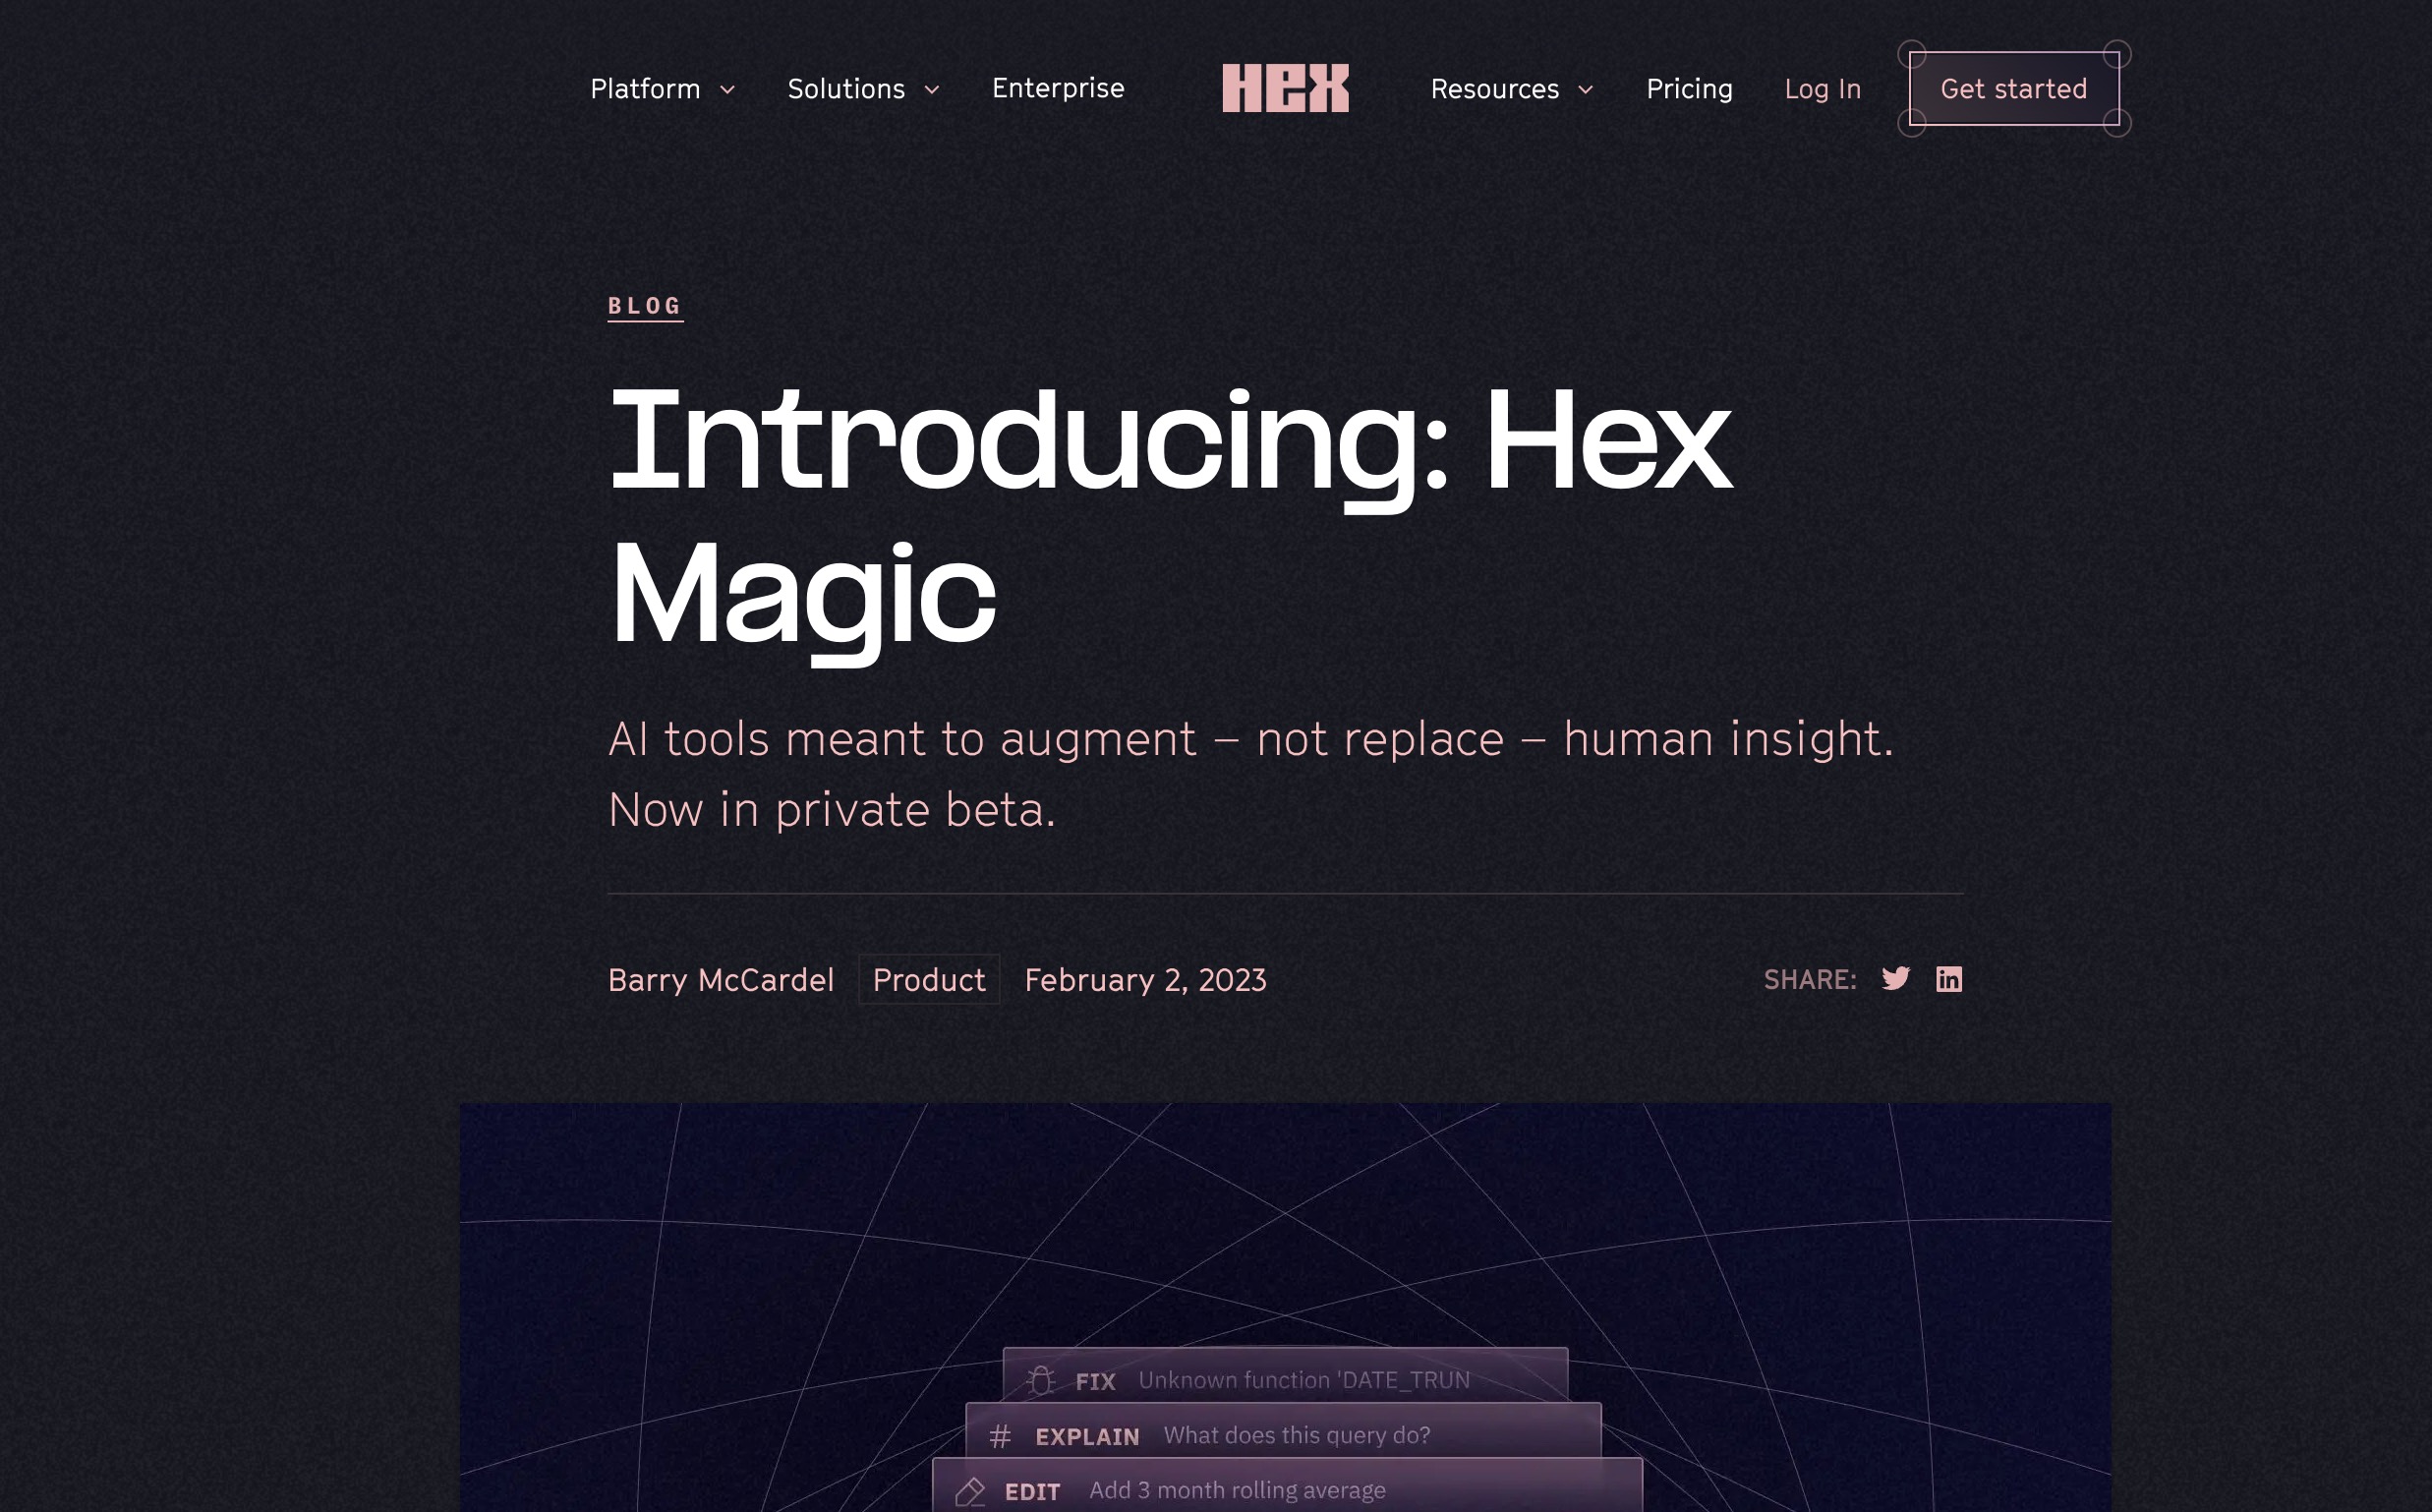
Hex Magic can help analysts:
Generate and explain SQL
Write or debug Python
Explore datasets
Build visualizations
Create reusable analytical workflows
Share interactive data applications
Collaborate on technical analysis
Key Use Cases
| Use Case | How Hex Helps |
|---|---|
| Warehouse Analysis | Queries cloud data platforms with SQL |
| Reproducible Research | Keeps code, results, and explanations together |
| Product Analytics | Builds reusable analyses for product teams |
| Data Applications | Turns notebook work into interactive tools |
| Analyst Collaboration | Supports shared technical workflows |
9. Research and Document Synthesis
Best for: Adding market, industry, and document context to analytical reports.
Internal data does not always explain the full situation. For example, a company may see declining sales in one market, but understanding the cause may require external information about:
Competitor pricing
Consumer trends
Regulatory changes
Macroeconomic conditions
Industry benchmarks
New technologies
Market events
Research agents can collect information from multiple sources, summarize it, and provide references for further review.
Perplexity: AI Research for Report Context
Perplexity combines web search with AI-generated answers and source links.
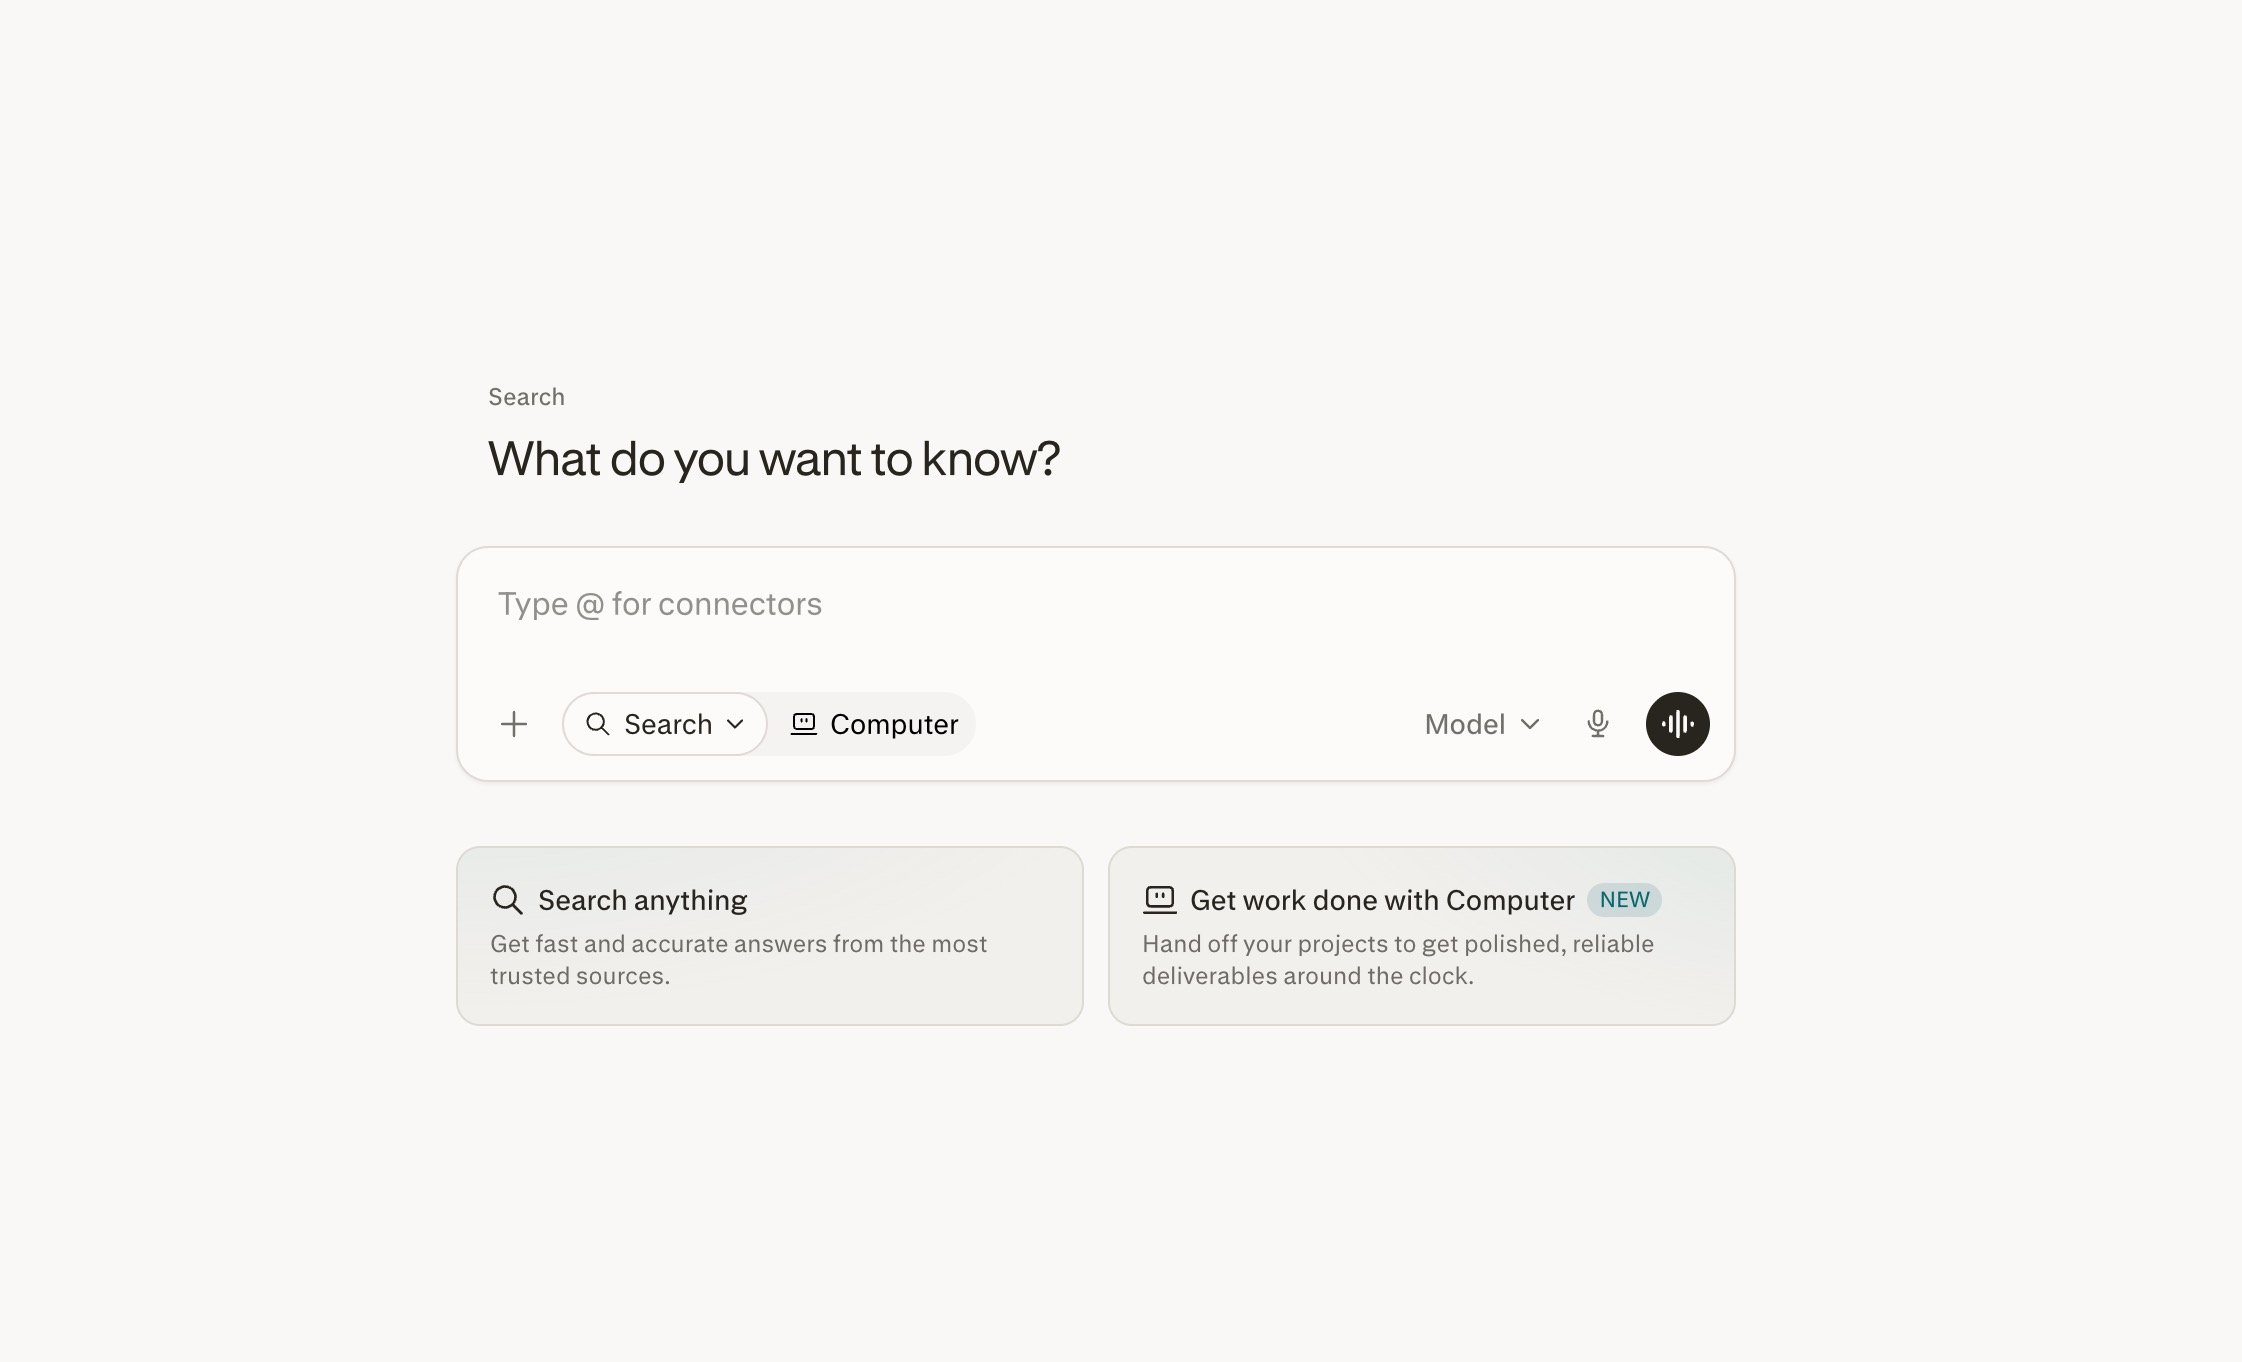
It is useful for analysts who need to add external context to internal findings.
Perplexity can help users:
Research market trends
Compare competitors
Find industry statistics
Summarize public information
Collect sources for reports
Investigate possible explanations for business changes
Key Use Cases
| Use Case | How Perplexity Helps |
|---|---|
| Market Research | Summarizes market size, growth, and trends |
| Competitor Analysis | Compares products, strategies, and positioning |
| Industry Reporting | Adds external context to company data |
| Benchmark Research | Finds publicly available performance benchmarks |
| Executive Briefings | Creates sourced summaries of current topics |
10. Presentation and Report Generation
Best for: Converting analytical findings into a stakeholder-friendly narrative.
A correct analysis can still fail if decision-makers cannot understand it. Reporting agents help transform technical findings into:
Executive summaries
Slide decks
Weekly reports
Client presentations
Business reviews
Strategic recommendations
A good reporting agent should not merely place charts on slides. It should organize the information into a logical narrative:
What happened?
Why did it happen?
Why does it matter?
What should the audience do next?
Gamma: AI-Assisted Presentation Generation
Gamma helps users create presentations, documents, and visual narratives from prompts or existing content.

It can assist with:
Generating presentation structures
Summarizing long content
Organizing findings into sections
Creating visual layouts
Rewriting content for different audiences
Producing shareable business documents
Key Use Cases
| Use Case | How Gamma Helps |
|---|---|
| Executive Presentations | Converts findings into concise slides |
| Client Reports | Creates polished, shareable deliverables |
| Business Reviews | Organizes KPIs and commentary |
| Strategy Documents | Structures analysis into recommendations |
| Internal Updates | Produces visual team reports quickly |
Comparison: Which AI Data Analysis Agent Should You Choose?
| Tool | Primary Strength | Best User | Coding Required | Reporting Capability |
|---|---|---|---|---|
| Powerdrill Bloom | General-purpose AI agent | Business users and analysts | No | High |
| Alteryx AiDIN | Data preparation and workflow automation | Enterprise data teams | Low to medium | Medium |
| ChatGPT Data Analysis | Flexible conversational analysis | General users and analysts | Optional | Medium |
| Julius AI | Fast exploratory analysis | Students, researchers, and business users | No | Medium |
| Tableau Agent | Interactive dashboards and BI | Enterprise analytics teams | Low | High |
| ThoughtSpot Spotter | KPI monitoring and proactive insights | Business and BI teams | No to low | High |
| DataRobot | Predictive modeling and forecasting | Data science and enterprise teams | Low to medium | Medium |
| Hex Magic | SQL, Python, and notebook workflows | Technical analysts | Optional to high | High |
| Perplexity | External research and synthesis | Researchers and strategists | No | Medium |
| Gamma | Presentation generation | Business and marketing teams | No | High |
Why Powerdrill Bloom Is the Best Overall Choice
The right tool depends on the workflow. DataRobot may be the better choice for enterprise machine learning. Tableau may be better for large-scale governed dashboards. Hex may be better for analysts who want direct control over SQL and Python.
However, many professionals are not trying to build an enterprise data platform. They need to answer a simpler but extremely common question: “How can I turn this spreadsheet into reliable insights and a clear report without spending hours cleaning data, creating charts, and formatting slides?”
That is where Powerdrill Bloom stands out. Bloom combines several agent skills in one workflow:
File understanding
Data preparation
Exploratory analysis
Natural-language interaction
Trend and anomaly discovery
Visualization recommendation
Business interpretation
Report generation
Presentation export
This end-to-end coverage makes it especially relevant for sales managers, marketers, operations teams, consultants, financial professionals, and other users who regularly work with spreadsheets and business reports.
How to Choose an AI Agent for Data Analysis and Reporting
1. Start With Your Data Source
If most of your work begins with Excel or CSV files, choose an agent that handles file uploads and spreadsheet structures well. On the other hand, if your data lives in a cloud warehouse, you should prioritize SQL connectivity, semantic models, and governance.
2. Decide Whether You Need Analysis or Monitoring
One-time analysis and continuous monitoring are entirely different workflows, so you must choose a tool that fits your specific use case. Specifically, choose file-based analysis for monthly reports and ad hoc questions, BI monitoring for live dashboards and KPI alerts, and predictive tools for forecasting and risk scoring.
3. Evaluate the Full Workflow
A tool may create excellent charts but provide limited data cleaning, while another may perform accurate analysis but require manual presentation work. To avoid workflow bottlenecks, calculate the total number of steps required to move from raw data to a final business decision.
4. Check Calculation Transparency
Users should be able to clearly inspect the underlying logic, including which columns were used, how metrics were calculated, which filters were applied, what assumptions were made, whether missing values were excluded, and how forecasts were validated. Keep in mind that AI-generated explanations should never replace manual calculation verification.
5. Review Export and Collaboration Options
A report is useful only if stakeholders can easily access it. Therefore, check whether the tool supports the formats and platforms your team already uses, such as PowerPoint, PDF, Notion, shared dashboards, images, spreadsheets, and collaborative workspaces.
6. Consider Security and Governance
Before uploading sensitive business data, carefully review the tool's data retention policies, model training policies, encryption, user permissions, workspace controls, compliance certifications, and data deletion options. Furthermore, organizations handling financial, healthcare, legal, or personal information should always complete an appropriate internal security review prior to adoption.
Best Practices for Using AI Agents in Data Analysis
AI agents can accelerate analytics, but they should be used with clear quality controls.
Verify Important Calculations
Recalculate critical KPIs independently, especially revenue, profit, forecasts, and regulated metrics.
Define Business Terms
Terms such as “active customer,” “conversion,” or “net revenue” may have company-specific definitions. Provide these definitions before asking an agent to analyze the data.
Ask for Assumptions
Require the agent to state how it handled missing values, duplicates, filters, and outliers.
Separate Facts From Interpretations
A report should clearly distinguish among what the data directly shows, what the analysis suggests, what remains uncertain, and what requires further investigation.
Keep a Human in the Approval Process
AI can prepare analysis and recommendations, but a qualified person should review high-impact conclusions before publication or action.
Final Verdict
End-to-end data analysis and reporting capabilities are becoming a key competitive advantage for AI agents in the data analytics space — helping users transform raw business files into reliable insights, visual analyses, and actionable reports. While specialized tools excel in areas such as data preparation, enterprise dashboards, predictive analytics, research, and presentation creation, Powerdrill Bloom delivers a more complete, all-in-one data analysis experience.
Without requiring SQL, Python, or manual chart creation, users can complete the entire workflow from data files to final reports. It supports analysis of business data from Excel, CSV, TSV, and other formats, automatically uncovers key trends, generates visualizations, and creates share-ready reports and presentations. For teams looking to improve analytical efficiency, reduce repetitive tasks, and gain faster business insights, Powerdrill Bloom is the ideal AI data analysis assistant.
Frequently Asked Questions
1. What is the best AI agent for data analysis and reporting?
Powerdrill Bloom is one of the best overall options for end-to-end data analysis and reporting. It can help users prepare uploaded data, identify trends, create visualizations, and turn findings into presentation-ready reports without requiring SQL or Python.
2. What are AI agent skills in data analysis?
AI agent skills are specialized capabilities such as data cleaning, exploratory analysis, natural-language querying, visualization, anomaly detection, forecasting, dashboard creation, and automated report generation.
3. Can AI automatically create a report from spreadsheet data?
Yes. An AI reporting agent can inspect a spreadsheet, calculate metrics, select visualizations, summarize findings, and organize the results into a report. The output should still be reviewed to confirm that calculations and interpretations are accurate.
4. What is the difference between an AI data analyst and a BI tool?
An AI data analyst uses natural-language instructions to explore data and complete analytical tasks. A traditional BI tool focuses more heavily on structured dashboards, data models, and recurring enterprise reporting.
5. Do I need SQL or Python to use an AI data analysis agent?
Not always. Tools such as Powerdrill Bloom, Julius AI, and conversational BI platforms allow users to perform many tasks without coding. Technical tools such as Hex also support SQL and Python when more control is required.